OPEN-SOURCE SCRIPT
업데이트됨 Sheabot Relative Volume and Range
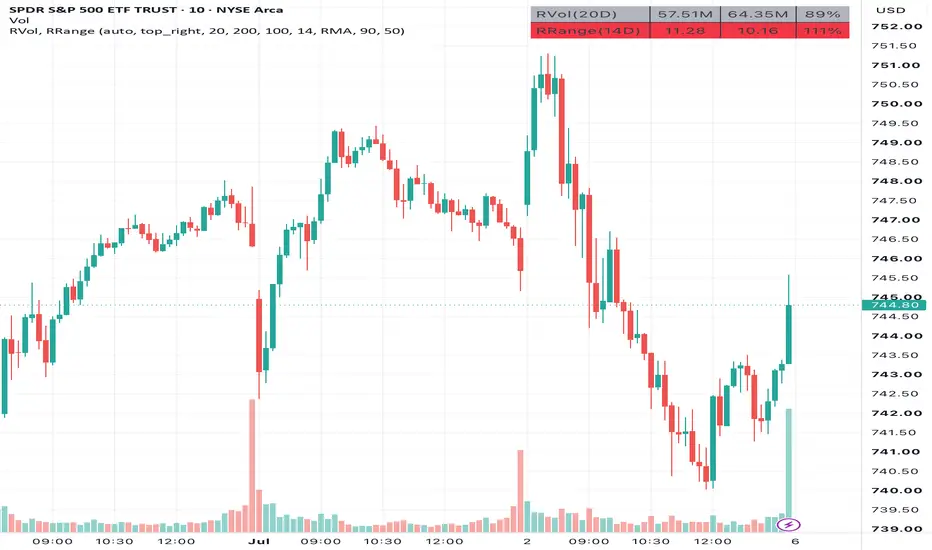
Display a combined table showing relative volume and relative range (also known as Daily True Range vs Average True Range) on all timeframes. The table rows change colors based on the relative volume and relative range values. The values and colors can be configured.
These indicators are combined together for a more efficient display in the same location. These indicators also commonly move together. A low relative volume will also likely have a low relative range. A high relative volume may accompany the price breaking out past the average range and a relative range over 100%. The relative range can also help set price targets. If the relative range is less than 100%, then the stock has not yet moved to its average range.
These concepts are used and inspired by the great @ripster47.
Relative Volume
Relative Range
These indicators are combined together for a more efficient display in the same location. These indicators also commonly move together. A low relative volume will also likely have a low relative range. A high relative volume may accompany the price breaking out past the average range and a relative range over 100%. The relative range can also help set price targets. If the relative range is less than 100%, then the stock has not yet moved to its average range.
These concepts are used and inspired by the great @ripster47.
Relative Volume
- Table displays current volume, average volume, and relative volume as a percent of current volume / average volume over the timeframe.
- When the timeframe is 1D or less, then the current volume is the volume for the day so far, and the average volume is calculated over the past bar length days.
- When the timeframe is greater than 1D, then the current volume is the volume for the week/month/year so far, and the average volume is calculated over the past bar length weeks/months/years.
- High Percent: Default is 100. Relative volume below this is considered low and the table row is colored grey. Relative volume above this is considered high and the table row is colored yellow.
- Unusual Percent. Default is 200. Relative volume above this is considered unusual and the table row is colored green.
Relative Range
- Table displays daily true range (DTR), average true range (ATR), and relative range as a percent of DTR / ATR over the timeframe.
- When the timeframe is 1D or less, then the daily true range is the difference between the high and low price since open, and the average true range is calculated over the past bar length days.
- When the timeframe is greater than 1D, then the daily true range is the difference between the high and low price for the past week/month/year, and the average true range is calculated over the past bar length weeks/months/years.
- Normal Percent: Default is 50. Relative range below this is considered low and the table row is colored grey. Relative range above this is considered normal and the table row is colored yellow.
- High Percent. Default is 90. Relative range above this is considered high and the table row is colored red.
릴리즈 노트
Update chart with just this indicator. Update Relative Volume Length default value.오픈 소스 스크립트
트레이딩뷰의 진정한 정신에 따라, 이 스크립트의 작성자는 이를 오픈소스로 공개하여 트레이더들이 기능을 검토하고 검증할 수 있도록 했습니다. 작성자에게 찬사를 보냅니다! 이 코드는 무료로 사용할 수 있지만, 코드를 재게시하는 경우 하우스 룰이 적용된다는 점을 기억하세요.

면책사항
해당 정보와 게시물은 금융, 투자, 트레이딩 또는 기타 유형의 조언이나 권장 사항으로 간주되지 않으며, 트레이딩뷰에서 제공하거나 보증하는 것이 아닙니다. 자세한 내용은 이용 약관을 참조하세요.
오픈 소스 스크립트
트레이딩뷰의 진정한 정신에 따라, 이 스크립트의 작성자는 이를 오픈소스로 공개하여 트레이더들이 기능을 검토하고 검증할 수 있도록 했습니다. 작성자에게 찬사를 보냅니다! 이 코드는 무료로 사용할 수 있지만, 코드를 재게시하는 경우 하우스 룰이 적용된다는 점을 기억하세요.
면책사항
해당 정보와 게시물은 금융, 투자, 트레이딩 또는 기타 유형의 조언이나 권장 사항으로 간주되지 않으며, 트레이딩뷰에서 제공하거나 보증하는 것이 아닙니다. 자세한 내용은 이용 약관을 참조하세요.