OPEN-SOURCE SCRIPT
RSI + MACD
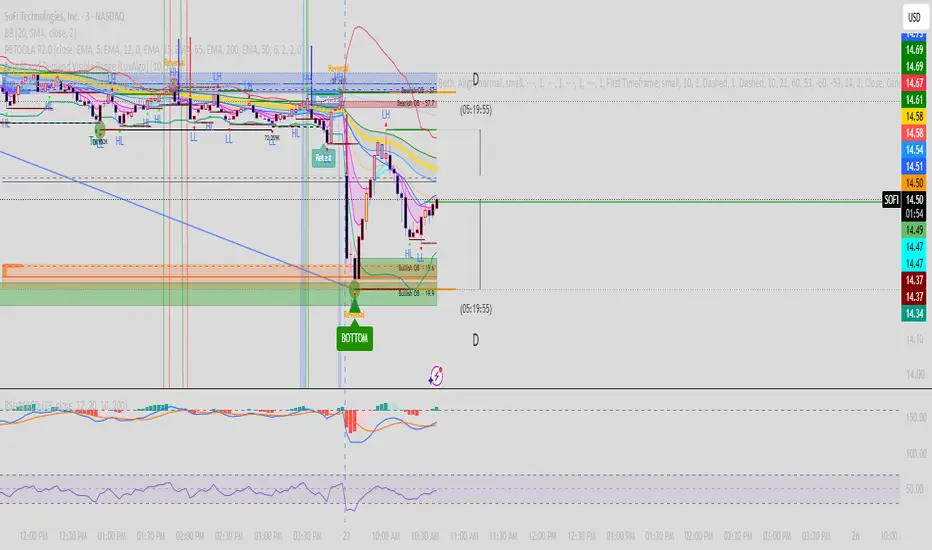
I got tired of burning two indicator slots on RSI and MACD, so I put both into one script. Same classic RSI and MACD you already know, just stacked in a single pane so you only use one slot.
What it does
RSI sits on the bottom (0 to 100) with the usual 30, 50 and 70 levels and the shaded band between 30 and 70. MACD sits on top with the MACD line, signal line and the four-color histogram that shows whether momentum is building or fading. Both use the standard TradingView colors and formulas, nothing custom or modified.
How it works
A script can only live in one pane, so I stacked them instead. RSI uses its normal 0 to 100 scale. MACD is auto-scaled to fit its own band above RSI, based on its recent range, and the lookback for that is adjustable in the settings. The numbers on the price axis aren’t the real MACD values because of that scaling. The actual RSI, MACD, signal and histogram readings are in the status line at the top of the pane, so you always see the true numbers.
Settings
RSI length and source (default 14, close)
MACD fast, slow and signal lengths (default 12, 26, 9)
MACD scale lookback (default 200 bars), which controls how tall the MACD swings look
Alerts included
MACD crossing above or below the signal line
RSI moving back above 30 or back below 70
How to use it
Use it the same way you would use RSI and MACD separately. Look at MACD crosses and histogram momentum for trend and timing, and RSI for overbought and oversold conditions. It works best when you look for the two agreeing with each other, like a MACD bullish cross while RSI is coming up out of oversold.
Heads up
This is a standard RSI and MACD, so it isn’t a signal generator on its own. Both indicators lag and can give false signals in choppy markets, so use it alongside your own analysis and risk management. This is for educational purposes only and isn’t financial advice.
If you find it useful, a like or a comment helps. Let me know if you want any changes or additions.
오픈 소스 스크립트
트레이딩뷰의 진정한 정신에 따라, 이 스크립트의 작성자는 이를 오픈소스로 공개하여 트레이더들이 기능을 검토하고 검증할 수 있도록 했습니다. 작성자에게 찬사를 보냅니다! 이 코드는 무료로 사용할 수 있지만, 코드를 재게시하는 경우 하우스 룰이 적용된다는 점을 기억하세요.

면책사항
해당 정보와 게시물은 금융, 투자, 트레이딩 또는 기타 유형의 조언이나 권장 사항으로 간주되지 않으며, 트레이딩뷰에서 제공하거나 보증하는 것이 아닙니다. 자세한 내용은 이용 약관을 참조하세요.
오픈 소스 스크립트
트레이딩뷰의 진정한 정신에 따라, 이 스크립트의 작성자는 이를 오픈소스로 공개하여 트레이더들이 기능을 검토하고 검증할 수 있도록 했습니다. 작성자에게 찬사를 보냅니다! 이 코드는 무료로 사용할 수 있지만, 코드를 재게시하는 경우 하우스 룰이 적용된다는 점을 기억하세요.
면책사항
해당 정보와 게시물은 금융, 투자, 트레이딩 또는 기타 유형의 조언이나 권장 사항으로 간주되지 않으며, 트레이딩뷰에서 제공하거나 보증하는 것이 아닙니다. 자세한 내용은 이용 약관을 참조하세요.