OPEN-SOURCE SCRIPT
1 HR Fair Value Gap
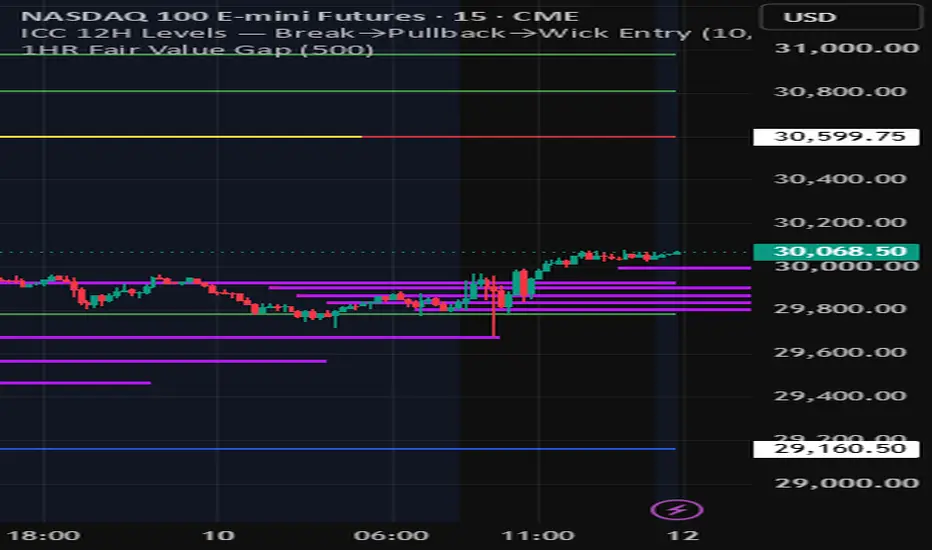
It draws 1-hour fair value gaps on your chart, no matter what timeframe you're looking at.
A fair value gap is a 3-candle imbalance: price moves so fast that the first and third candles don't overlap, leaving a gap. The code checks confirmed 1-hour candles and finds two kinds — bullish (gap up, `h3 < l1`) and bearish (gap down, `l3 > h1`).
When it finds one, it does two things: draws a colored box marking the gap, and draws a line at the 50% midpoint of that gap extended 24 hours to the right. The midline is the part you actually trade off of — where price is likely to return and react.
The `bars24h` piece just makes "24 hours" translate correctly to any chart, since 24 hours is 288 bars on a 5-minute chart but only 24 bars on a 1-hour chart. And the age-out at the bottom stops tracking each midline once it's 24 hours old, so old levels drop off.
That's the whole thing — pure levels, no signals, no bias, no alerts.
A fair value gap is a 3-candle imbalance: price moves so fast that the first and third candles don't overlap, leaving a gap. The code checks confirmed 1-hour candles and finds two kinds — bullish (gap up, `h3 < l1`) and bearish (gap down, `l3 > h1`).
When it finds one, it does two things: draws a colored box marking the gap, and draws a line at the 50% midpoint of that gap extended 24 hours to the right. The midline is the part you actually trade off of — where price is likely to return and react.
The `bars24h` piece just makes "24 hours" translate correctly to any chart, since 24 hours is 288 bars on a 5-minute chart but only 24 bars on a 1-hour chart. And the age-out at the bottom stops tracking each midline once it's 24 hours old, so old levels drop off.
That's the whole thing — pure levels, no signals, no bias, no alerts.
오픈 소스 스크립트
트레이딩뷰의 진정한 정신에 따라, 이 스크립트의 작성자는 이를 오픈소스로 공개하여 트레이더들이 기능을 검토하고 검증할 수 있도록 했습니다. 작성자에게 찬사를 보냅니다! 이 코드는 무료로 사용할 수 있지만, 코드를 재게시하는 경우 하우스 룰이 적용된다는 점을 기억하세요.

면책사항
해당 정보와 게시물은 금융, 투자, 트레이딩 또는 기타 유형의 조언이나 권장 사항으로 간주되지 않으며, 트레이딩뷰에서 제공하거나 보증하는 것이 아닙니다. 자세한 내용은 이용 약관을 참조하세요.
오픈 소스 스크립트
트레이딩뷰의 진정한 정신에 따라, 이 스크립트의 작성자는 이를 오픈소스로 공개하여 트레이더들이 기능을 검토하고 검증할 수 있도록 했습니다. 작성자에게 찬사를 보냅니다! 이 코드는 무료로 사용할 수 있지만, 코드를 재게시하는 경우 하우스 룰이 적용된다는 점을 기억하세요.
면책사항
해당 정보와 게시물은 금융, 투자, 트레이딩 또는 기타 유형의 조언이나 권장 사항으로 간주되지 않으며, 트레이딩뷰에서 제공하거나 보증하는 것이 아닙니다. 자세한 내용은 이용 약관을 참조하세요.