Session VWAP with Measured Band Reach
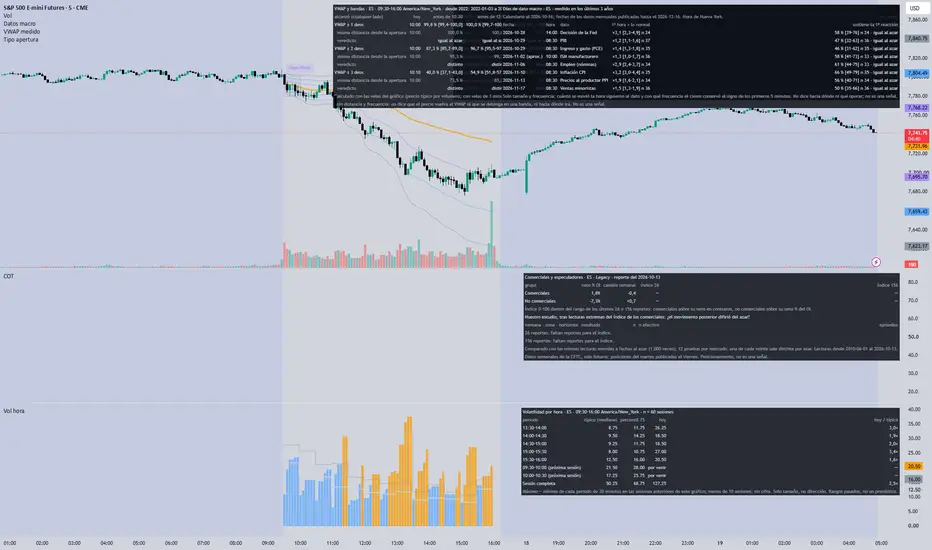
Session VWAP of the regular session with bands at 1, 2 and 3 standard deviations, computed from the chart's bars, and how often each band was reached by 10:30, 12:00, 14:00 and the close in this market, against the same distance measured from the session's open.
WHAT IT SHOWS
- The VWAP line and the ±1, ±2 and ±3 standard deviation bands of today's regular session (09:30-16:00 New York).
- A table, per band: the share of sessions (since 2022) in which a bar reached the band before each checkpoint, with its sample size (n) and 95% interval, next to the share that reached the same distance from the open. When the interval of the difference holds zero, it reads "same as chance": the VWAP band was reached as often as any point that far from the open.
- Today: whether and when each band was reached.
HOW IT WORKS
- Each bar adds its typical price ((high + low + close) / 3) weighted by its volume from the first bar of the regular session: VWAP = sum(price x volume) / sum(volume). The bands are the VWAP plus and minus k standard deviations of those prices around the VWAP, weighted by volume. It is computed from the chart's bars, so it approximates a VWAP built trade by trade; on a 1-minute chart it follows the same arithmetic as our table.
- A touch counts from 10:00 (the first 30 minutes build the bands) and compares each bar with the band known at the end of the previous bar, on either side.
- The statistics are embedded from our own measurement on historical 1-minute data (8 markets) and refreshed with each update of the script; other markets get the line without the table.
LIMITS
- Distance and frequency only. It does not say that price returns to the VWAP or stops at a band, and it is not a signal or a recommendation.
- In the measured markets the outer bands were reached less often than the same distance from the open, because the VWAP moves with price.
Languages: Spanish, English and Portuguese (input). Alerts: band 1, 2 or 3 reached for the first time today.
WHAT IT SHOWS
- The VWAP line and the ±1, ±2 and ±3 standard deviation bands of today's regular session (09:30-16:00 New York).
- A table, per band: the share of sessions (since 2022) in which a bar reached the band before each checkpoint, with its sample size (n) and 95% interval, next to the share that reached the same distance from the open. When the interval of the difference holds zero, it reads "same as chance": the VWAP band was reached as often as any point that far from the open.
- Today: whether and when each band was reached.
HOW IT WORKS
- Each bar adds its typical price ((high + low + close) / 3) weighted by its volume from the first bar of the regular session: VWAP = sum(price x volume) / sum(volume). The bands are the VWAP plus and minus k standard deviations of those prices around the VWAP, weighted by volume. It is computed from the chart's bars, so it approximates a VWAP built trade by trade; on a 1-minute chart it follows the same arithmetic as our table.
- A touch counts from 10:00 (the first 30 minutes build the bands) and compares each bar with the band known at the end of the previous bar, on either side.
- The statistics are embedded from our own measurement on historical 1-minute data (8 markets) and refreshed with each update of the script; other markets get the line without the table.
LIMITS
- Distance and frequency only. It does not say that price returns to the VWAP or stops at a band, and it is not a signal or a recommendation.
- In the measured markets the outer bands were reached less often than the same distance from the open, because the VWAP moves with price.
Languages: Spanish, English and Portuguese (input). Alerts: band 1, 2 or 3 reached for the first time today.

Perfiltrade — futures analysis with the sample in plain sight: historical base rates, Market Profile and COT across 30 instruments. No signals, no black boxes. perfiltrade.com
면책사항
해당 정보와 게시물은 금융, 투자, 트레이딩 또는 기타 유형의 조언이나 권장 사항으로 간주되지 않으며, 트레이딩뷰에서 제공하거나 보증하는 것이 아닙니다. 자세한 내용은 이용 약관을 참조하세요.
Perfiltrade — futures analysis with the sample in plain sight: historical base rates, Market Profile and COT across 30 instruments. No signals, no black boxes. perfiltrade.com
면책사항
해당 정보와 게시물은 금융, 투자, 트레이딩 또는 기타 유형의 조언이나 권장 사항으로 간주되지 않으며, 트레이딩뷰에서 제공하거나 보증하는 것이 아닙니다. 자세한 내용은 이용 약관을 참조하세요.