OPEN-SOURCE SCRIPT
ADR Contraction Tightness
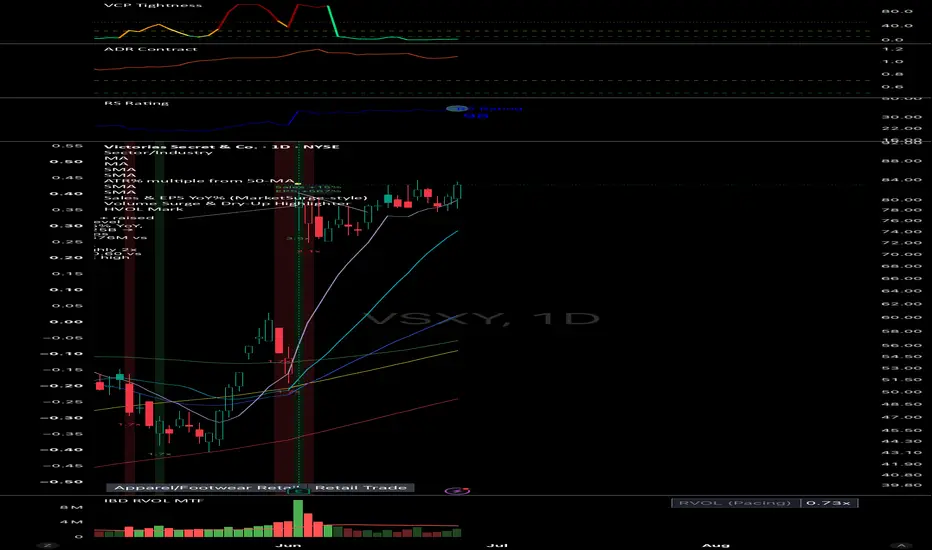
HAT IT IS
// Measures how much a stock's recent daily range has dried up versus its
// ~2.5-month baseline. A single ratio:
//
// bar_range_pct = (high - low) / low * 100 // each bar's range %
// adr_pct_short = ta.sma(bar_range_pct, 20) // recent avg daily range %
// adr_pct_long = ta.sma(bar_range_pct, 50) // baseline avg daily range %
// contraction_ratio = adr_pct_short / adr_pct_long // LOWER = TIGHTER
//
// "Tight base" when contraction_ratio <= 1.00
// "Super-tight" when contraction_ratio <= 0.70
//
// STUDY PROVENANCE
// This is measure B_0.7 ("absolute ADR% contraction") — the tightness
// measure that won the ATR Extension Study tightness-measure bake-off
// (engine: atr_phase7.py §15.6, branch atr-study). In that study B_0.7 was
// the most selective qualifier of the +50% movers: best P(+50%) lift and
// ~10 days faster to the move, versus the old normalized 0–100 VCP score
// which fired on ~99% of names. Lower = tighter. This replaces the VCP
// Tightness Score pane and is built to feed a TradingView Pine Screener.
// Measures how much a stock's recent daily range has dried up versus its
// ~2.5-month baseline. A single ratio:
//
// bar_range_pct = (high - low) / low * 100 // each bar's range %
// adr_pct_short = ta.sma(bar_range_pct, 20) // recent avg daily range %
// adr_pct_long = ta.sma(bar_range_pct, 50) // baseline avg daily range %
// contraction_ratio = adr_pct_short / adr_pct_long // LOWER = TIGHTER
//
// "Tight base" when contraction_ratio <= 1.00
// "Super-tight" when contraction_ratio <= 0.70
//
// STUDY PROVENANCE
// This is measure B_0.7 ("absolute ADR% contraction") — the tightness
// measure that won the ATR Extension Study tightness-measure bake-off
// (engine: atr_phase7.py §15.6, branch atr-study). In that study B_0.7 was
// the most selective qualifier of the +50% movers: best P(+50%) lift and
// ~10 days faster to the move, versus the old normalized 0–100 VCP score
// which fired on ~99% of names. Lower = tighter. This replaces the VCP
// Tightness Score pane and is built to feed a TradingView Pine Screener.
오픈 소스 스크립트
트레이딩뷰의 진정한 정신에 따라, 이 스크립트의 작성자는 이를 오픈소스로 공개하여 트레이더들이 기능을 검토하고 검증할 수 있도록 했습니다. 작성자에게 찬사를 보냅니다! 이 코드는 무료로 사용할 수 있지만, 코드를 재게시하는 경우 하우스 룰이 적용된다는 점을 기억하세요.

면책사항
해당 정보와 게시물은 금융, 투자, 트레이딩 또는 기타 유형의 조언이나 권장 사항으로 간주되지 않으며, 트레이딩뷰에서 제공하거나 보증하는 것이 아닙니다. 자세한 내용은 이용 약관을 참조하세요.
오픈 소스 스크립트
트레이딩뷰의 진정한 정신에 따라, 이 스크립트의 작성자는 이를 오픈소스로 공개하여 트레이더들이 기능을 검토하고 검증할 수 있도록 했습니다. 작성자에게 찬사를 보냅니다! 이 코드는 무료로 사용할 수 있지만, 코드를 재게시하는 경우 하우스 룰이 적용된다는 점을 기억하세요.
면책사항
해당 정보와 게시물은 금융, 투자, 트레이딩 또는 기타 유형의 조언이나 권장 사항으로 간주되지 않으며, 트레이딩뷰에서 제공하거나 보증하는 것이 아닙니다. 자세한 내용은 이용 약관을 참조하세요.