OPEN-SOURCE SCRIPT
Asymmetric Volatility Trend Line [QuantAlgo]
🟢 Overview
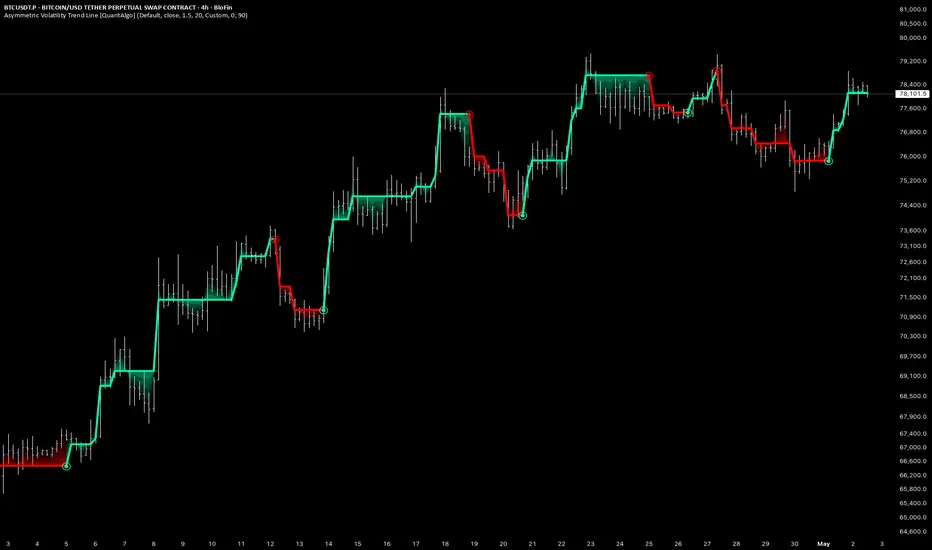
Asymmetric Volatility Trend Line is a trend-following indicator built on adaptive standard deviation thresholds rather than fixed bands or moving average crossovers. It quantifies the statistical volatility of recent price movement to determine asymmetric conditions for trend continuation versus trend reversal, then uses those conditions to anchor a dynamic trend line that adjusts position in response to confirmed directional moves, helping traders distinguish between genuine breakouts and noise-driven fluctuations across every timeframe and market.

🟢 How It Works
The foundation of the indicator is a rolling standard deviation applied to the selected price source over a configurable lookback window, scaled by a threshold multiplier to produce the volatility boundary used in all trend logic:
Pine Script®
This threshold is intentionally asymmetric in application. When the trend line is in a bullish state, a smaller fraction of the threshold (0.5x) is required for price to confirm continuation, while a full threshold breach in the opposite direction is needed to trigger a reversal. The same asymmetry applies in reverse during bearish states:
Pine Script®
This design means continuation requires less evidence than reversal. A directional move only needs to exceed half the volatility threshold to sustain the current trend, but must overcome the full threshold to flip it. The 0.25x offset applied when repositioning the trend line keeps it anchored within the volatility envelope rather than jumping directly to price, producing a smoother line that does not overreact to a single bar.
When a reversal is confirmed, the trend line is placed on the opposite side of price at a quarter-threshold distance, giving it room to develop without immediately triggering another flip:
Pine Script®
Direction state is tracked through two integer variables, with reversal conditions derived from comparing the current and prior bar states:
Pine Script®

🟢 Signal Interpretation
▶ Bullish Trend (Green): When price closes above the trend line by more than half the volatility threshold, the indicator enters bullish mode with green colouring applied across the trend line, gradient fill, and reversal marker (⦿). This state persists until price closes below the trend line by the full volatility threshold, allowing normal pullbacks to occur without triggering a direction change.
▶ Bearish Trend (Red): When price closes below the trend line by more than half the volatility threshold, the indicator enters bearish mode with red colouring across all visual elements. A full threshold breach to the upside is required to exit this bearish state.

🟢 Features
▶ Preconfigured Presets: Three parameter sets cover different trading approaches. "Default" targets swing trading on 4-hour and daily charts with moderate threshold sensitivity. "Fast Response" reduces the volatility barrier and shortens the lookback for intraday charts where the indicator needs to adapt to shorter-duration moves. "Smooth Trend" raises the reversal threshold substantially for position trading on daily and weekly timeframes, where the cost of a false flip is higher than the cost of a delayed one. Selecting a preset overrides the individual multiplier and lookback inputs.

▶ Built-in Alerts: Three alert conditions cover all directional states. "Bullish Trend Signal" fires on the bar where the trend direction flips from bearish to bullish. "Bearish Trend Signal" fires on the bar where it flips from bullish to bearish. "Any Trend Change" combines both into a single condition for traders who want a unified notification regardless of direction.

▶ Visual Customisation: Six colour presets (Classic, Aqua, Cosmic, Cyber, Neon, and Custom) apply coordinated bullish and bearish colour schemes across the trend line, gradient fill, reversal markers, and optional bar and background colouring. Bar colouring tints price candles with the active trend colour at a configurable transparency level, and background colouring extends the directional tint across the full chart pane. Both are disabled by default and controlled independently.

Asymmetric Volatility Trend Line is a trend-following indicator built on adaptive standard deviation thresholds rather than fixed bands or moving average crossovers. It quantifies the statistical volatility of recent price movement to determine asymmetric conditions for trend continuation versus trend reversal, then uses those conditions to anchor a dynamic trend line that adjusts position in response to confirmed directional moves, helping traders distinguish between genuine breakouts and noise-driven fluctuations across every timeframe and market.
🟢 How It Works
The foundation of the indicator is a rolling standard deviation applied to the selected price source over a configurable lookback window, scaled by a threshold multiplier to produce the volatility boundary used in all trend logic:
This threshold is intentionally asymmetric in application. When the trend line is in a bullish state, a smaller fraction of the threshold (0.5x) is required for price to confirm continuation, while a full threshold breach in the opposite direction is needed to trigger a reversal. The same asymmetry applies in reverse during bearish states:
This design means continuation requires less evidence than reversal. A directional move only needs to exceed half the volatility threshold to sustain the current trend, but must overcome the full threshold to flip it. The 0.25x offset applied when repositioning the trend line keeps it anchored within the volatility envelope rather than jumping directly to price, producing a smoother line that does not overreact to a single bar.
When a reversal is confirmed, the trend line is placed on the opposite side of price at a quarter-threshold distance, giving it room to develop without immediately triggering another flip:
Direction state is tracked through two integer variables, with reversal conditions derived from comparing the current and prior bar states:
🟢 Signal Interpretation
▶ Bullish Trend (Green): When price closes above the trend line by more than half the volatility threshold, the indicator enters bullish mode with green colouring applied across the trend line, gradient fill, and reversal marker (⦿). This state persists until price closes below the trend line by the full volatility threshold, allowing normal pullbacks to occur without triggering a direction change.
▶ Bearish Trend (Red): When price closes below the trend line by more than half the volatility threshold, the indicator enters bearish mode with red colouring across all visual elements. A full threshold breach to the upside is required to exit this bearish state.
🟢 Features
▶ Preconfigured Presets: Three parameter sets cover different trading approaches. "Default" targets swing trading on 4-hour and daily charts with moderate threshold sensitivity. "Fast Response" reduces the volatility barrier and shortens the lookback for intraday charts where the indicator needs to adapt to shorter-duration moves. "Smooth Trend" raises the reversal threshold substantially for position trading on daily and weekly timeframes, where the cost of a false flip is higher than the cost of a delayed one. Selecting a preset overrides the individual multiplier and lookback inputs.
▶ Built-in Alerts: Three alert conditions cover all directional states. "Bullish Trend Signal" fires on the bar where the trend direction flips from bearish to bullish. "Bearish Trend Signal" fires on the bar where it flips from bullish to bearish. "Any Trend Change" combines both into a single condition for traders who want a unified notification regardless of direction.
▶ Visual Customisation: Six colour presets (Classic, Aqua, Cosmic, Cyber, Neon, and Custom) apply coordinated bullish and bearish colour schemes across the trend line, gradient fill, reversal markers, and optional bar and background colouring. Bar colouring tints price candles with the active trend colour at a configurable transparency level, and background colouring extends the directional tint across the full chart pane. Both are disabled by default and controlled independently.
오픈 소스 스크립트
트레이딩뷰의 진정한 정신에 따라, 이 스크립트의 작성자는 이를 오픈소스로 공개하여 트레이더들이 기능을 검토하고 검증할 수 있도록 했습니다. 작성자에게 찬사를 보냅니다! 이 코드는 무료로 사용할 수 있지만, 코드를 재게시하는 경우 하우스 룰이 적용된다는 점을 기억하세요.

🟢 Access our best trading & investing tools: joinquantalgo.com/plans
🟢 Free Special Edition indicators: joinquantalgo.com/special-editions
🟢 Discord: discord.gg/hJaFyGEAyX
🟢 Free Special Edition indicators: joinquantalgo.com/special-editions
🟢 Discord: discord.gg/hJaFyGEAyX
면책사항
해당 정보와 게시물은 금융, 투자, 트레이딩 또는 기타 유형의 조언이나 권장 사항으로 간주되지 않으며, 트레이딩뷰에서 제공하거나 보증하는 것이 아닙니다. 자세한 내용은 이용 약관을 참조하세요.
오픈 소스 스크립트
트레이딩뷰의 진정한 정신에 따라, 이 스크립트의 작성자는 이를 오픈소스로 공개하여 트레이더들이 기능을 검토하고 검증할 수 있도록 했습니다. 작성자에게 찬사를 보냅니다! 이 코드는 무료로 사용할 수 있지만, 코드를 재게시하는 경우 하우스 룰이 적용된다는 점을 기억하세요.
🟢 Access our best trading & investing tools: joinquantalgo.com/plans
🟢 Free Special Edition indicators: joinquantalgo.com/special-editions
🟢 Discord: discord.gg/hJaFyGEAyX
🟢 Free Special Edition indicators: joinquantalgo.com/special-editions
🟢 Discord: discord.gg/hJaFyGEAyX
면책사항
해당 정보와 게시물은 금융, 투자, 트레이딩 또는 기타 유형의 조언이나 권장 사항으로 간주되지 않으며, 트레이딩뷰에서 제공하거나 보증하는 것이 아닙니다. 자세한 내용은 이용 약관을 참조하세요.