업데이트됨
MSNR Order Block QML Indicator
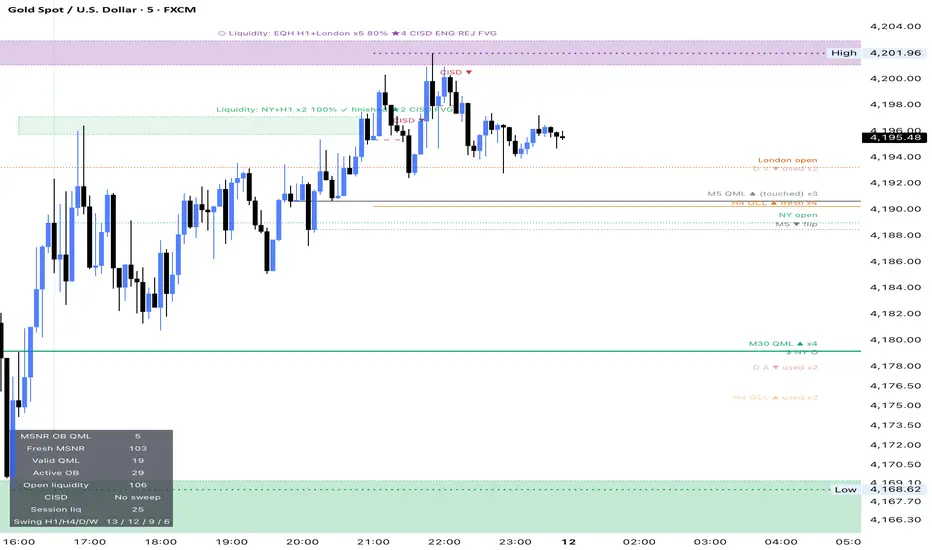
MSNR Order Block QML Indicator
A display-only, multi-timeframe indicator for gold and other markets. It draws structure on the chart and gives no buy or sell signals and no entries, stops or targets. What you trade is your decision.
WHAT IT DRAWS
MSNR levels (Malaysian Support & Resistance)
V, A and OCL levels built from H4, Daily, Weekly and Monthly candles. Each level is marked fresh until price first touches it, and touched levels can stay on the chart faded. H4 levels convert to RBS/SBR when an H1 candle closes through them. Support is a solid line (▲) and resistance is a dashed line (▼). Weekly and Monthly levels are backfilled from higher-timeframe history.
QML (Quasimodo) lines
Close-based Quasimodo structures on M5, M15, M30, H1 and optionally H4. A QML is drawn as a line at its level. A grey dashed "flip" line sits at the head's close. If a candle on the QML's own timeframe closes beyond that line, the QML is invalidated and removed.
Order blocks with a 0.5 line
The last opposite candle before a displacement that breaks the recent range, with its midpoint line. A block is removed when a candle on its own timeframe closes through it. Order block timeframes are chosen separately from QML timeframes.
External liquidity ($)
The last confirmed swing highs and lows of H1, H4 and Daily that have not been taken yet, labelled "$ H1", "$ H4" and "$ D".
CISD (M5 chart only)
After a wick takes an H1, H4 or Daily swing level, the first M5 close beyond the open of the last same-direction candle run is marked CISD ▲ or CISD ▼.
CLEAN-CHART TOOLS
- Colour by timeframe: each timeframe has one colour across MSNR, QML, order blocks and liquidity.
- Only items within a set multiple of the Daily ATR of price are drawn.
- Only the nearest N items per type, per side, are shown.
- Items of the same type and direction within a set dollar range (default $10) are merged. The most recently formed one is drawn and its label shows the count (x2, x3).
- All labels sit in one right-aligned column, spaced so they do not overlap.
NOTES
- Works on any chart timeframe. A source timeframe lower than the chart is switched off. H4 RBS/SBR conversion needs a chart of H1 or lower, and CISD needs an M5 chart.
- Higher-timeframe data uses closed candles only.
- Daily, weekly and monthly backfilled levels only become active on the last bar, so past bars show levels built from the candles on your chart.
- Everything is redrawn at candle close.
DISCLAIMER
For educational and informational use only. This is not financial advice, and no result is implied or guaranteed. Test it on your own charts and use your own risk management.
A display-only, multi-timeframe indicator for gold and other markets. It draws structure on the chart and gives no buy or sell signals and no entries, stops or targets. What you trade is your decision.
WHAT IT DRAWS
MSNR levels (Malaysian Support & Resistance)
V, A and OCL levels built from H4, Daily, Weekly and Monthly candles. Each level is marked fresh until price first touches it, and touched levels can stay on the chart faded. H4 levels convert to RBS/SBR when an H1 candle closes through them. Support is a solid line (▲) and resistance is a dashed line (▼). Weekly and Monthly levels are backfilled from higher-timeframe history.
QML (Quasimodo) lines
Close-based Quasimodo structures on M5, M15, M30, H1 and optionally H4. A QML is drawn as a line at its level. A grey dashed "flip" line sits at the head's close. If a candle on the QML's own timeframe closes beyond that line, the QML is invalidated and removed.
Order blocks with a 0.5 line
The last opposite candle before a displacement that breaks the recent range, with its midpoint line. A block is removed when a candle on its own timeframe closes through it. Order block timeframes are chosen separately from QML timeframes.
External liquidity ($)
The last confirmed swing highs and lows of H1, H4 and Daily that have not been taken yet, labelled "$ H1", "$ H4" and "$ D".
CISD (M5 chart only)
After a wick takes an H1, H4 or Daily swing level, the first M5 close beyond the open of the last same-direction candle run is marked CISD ▲ or CISD ▼.
CLEAN-CHART TOOLS
- Colour by timeframe: each timeframe has one colour across MSNR, QML, order blocks and liquidity.
- Only items within a set multiple of the Daily ATR of price are drawn.
- Only the nearest N items per type, per side, are shown.
- Items of the same type and direction within a set dollar range (default $10) are merged. The most recently formed one is drawn and its label shows the count (x2, x3).
- All labels sit in one right-aligned column, spaced so they do not overlap.
NOTES
- Works on any chart timeframe. A source timeframe lower than the chart is switched off. H4 RBS/SBR conversion needs a chart of H1 or lower, and CISD needs an M5 chart.
- Higher-timeframe data uses closed candles only.
- Daily, weekly and monthly backfilled levels only become active on the last bar, so past bars show levels built from the candles on your chart.
- Everything is redrawn at candle close.
DISCLAIMER
For educational and informational use only. This is not financial advice, and no result is implied or guaranteed. Test it on your own charts and use your own risk management.
릴리즈 노트
I have added liquidity 릴리즈 노트
This public version is retired and no longer maintained.릴리즈 노트
Renamed to testing. This public version is retired.
면책사항
해당 정보와 게시물은 금융, 투자, 트레이딩 또는 기타 유형의 조언이나 권장 사항으로 간주되지 않으며, 트레이딩뷰에서 제공하거나 보증하는 것이 아닙니다. 자세한 내용은 이용 약관을 참조하세요.
면책사항
해당 정보와 게시물은 금융, 투자, 트레이딩 또는 기타 유형의 조언이나 권장 사항으로 간주되지 않으며, 트레이딩뷰에서 제공하거나 보증하는 것이 아닙니다. 자세한 내용은 이용 약관을 참조하세요.