OPEN-SOURCE SCRIPT
QuantumPips Flow Bias
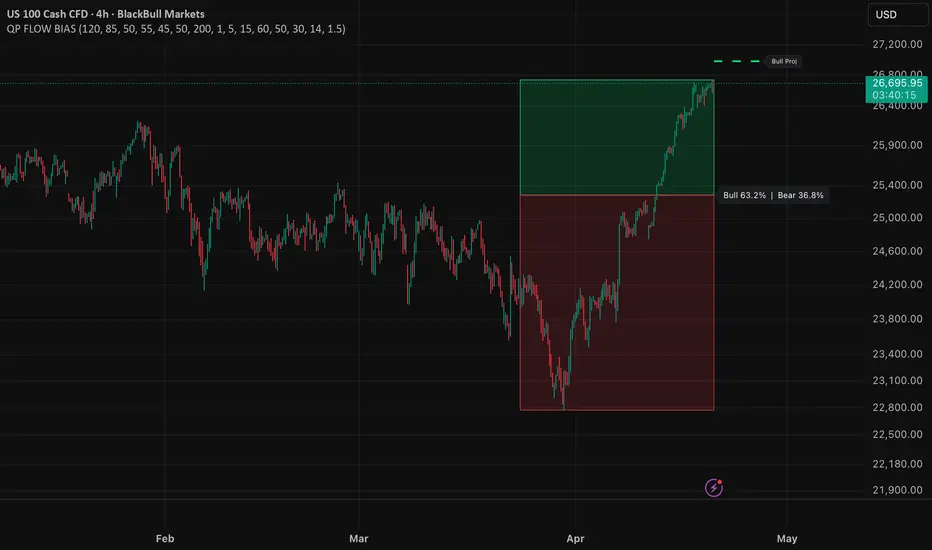
QuantumPips Flow Bias (EMA + Volume Delta)
QuantumPips Flow Bias is a visual market-bias tool that combines trend direction (EMA) with a simple volume-pressure proxy to help you read whether buyers or sellers have had more control over the most recent price action.
This indicator is not a signal generator by default, it’s designed to give you context and confirmation so you can align entries with stronger market conditions.
1) What you see on the chart
Bull/Bear Flow Box
A large box is drawn using the last Lookback bars:
This percentage is calculated using a volume delta proxy:
It’s a proxy, not true exchange order flow, but it’s useful for quickly spotting whether volume has mostly supported buying or selling inside the lookback window.
2) Trend Confirmation (EMA)
The indicator checks the trend using two EMAs:
When fast EMA is above slow EMA → trend bias is bullish
When fast EMA is below slow EMA → trend bias is bearish
Optional: Require EMA Fast slope
If ON, the fast EMA must also be rising (bull) or falling (bear). This filters chop but may reduce early bias flips.
3) Volume Delta Confirm (Proxy)
A second “pressure check” runs on a shorter window: Delta window (bars).
Defaults:
Bull confirm if Bull% > 55%
Bear confirm if Bull% < 45%
4) Bias logic (how “Bullish/Bearish/Neutral” is decided)
The indicator only shows a strong bias when both conditions agree:
✅ Bullish = (EMA trend bullish) AND (flow bullish)
✅ Bearish = (EMA trend bearish) AND (flow bearish)
Otherwise → Neutral (mixed or choppy conditions)
5) Projection line (dashed)
The dashed line is a simple forward “roadmap” based on:
This projection is best used as a reference area, not a target guarantee. It’s meant to help you visualize where price could reach if the bias continues.
QuantumPips Flow Bias is a visual market-bias tool that combines trend direction (EMA) with a simple volume-pressure proxy to help you read whether buyers or sellers have had more control over the most recent price action.
This indicator is not a signal generator by default, it’s designed to give you context and confirmation so you can align entries with stronger market conditions.
1) What you see on the chart
Bull/Bear Flow Box
A large box is drawn using the last Lookback bars:
- Green area = bullish pressure
- Red area = bearish pressure
- The label shows the split as:
- Bull X% | Bear Y%
This percentage is calculated using a volume delta proxy:
- If a candle closes up, its volume is treated as “bull volume”
- If a candle closes down, its volume is treated as “bear volume”
- Doji candles split volume 50/50
It’s a proxy, not true exchange order flow, but it’s useful for quickly spotting whether volume has mostly supported buying or selling inside the lookback window.
2) Trend Confirmation (EMA)
The indicator checks the trend using two EMAs:
- EMA Fast (default 50)
- EMA Slow (default 200)
When fast EMA is above slow EMA → trend bias is bullish
When fast EMA is below slow EMA → trend bias is bearish
Optional: Require EMA Fast slope
If ON, the fast EMA must also be rising (bull) or falling (bear). This filters chop but may reduce early bias flips.
3) Volume Delta Confirm (Proxy)
A second “pressure check” runs on a shorter window: Delta window (bars).
- If Bull% is above Bull threshold → bull flow confirmation
- If Bull% is below Bear threshold → bear flow confirmation
Defaults:
Bull confirm if Bull% > 55%
Bear confirm if Bull% < 45%
4) Bias logic (how “Bullish/Bearish/Neutral” is decided)
The indicator only shows a strong bias when both conditions agree:
✅ Bullish = (EMA trend bullish) AND (flow bullish)
✅ Bearish = (EMA trend bearish) AND (flow bearish)
Otherwise → Neutral (mixed or choppy conditions)
5) Projection line (dashed)
The dashed line is a simple forward “roadmap” based on:
- ATR distance × multiplier
- Optionally scaled by flow strength
This projection is best used as a reference area, not a target guarantee. It’s meant to help you visualize where price could reach if the bias continues.
오픈 소스 스크립트
트레이딩뷰의 진정한 정신에 따라, 이 스크립트의 작성자는 이를 오픈소스로 공개하여 트레이더들이 기능을 검토하고 검증할 수 있도록 했습니다. 작성자에게 찬사를 보냅니다! 이 코드는 무료로 사용할 수 있지만, 코드를 재게시하는 경우 하우스 룰이 적용된다는 점을 기억하세요.

QuantumPips — Trade Structure. Not Noise.
Market Structure Pro (Invite-only): quantumpips.io/msp
Educational only. Not financial advice.
Market Structure Pro (Invite-only): quantumpips.io/msp
Educational only. Not financial advice.
면책사항
해당 정보와 게시물은 금융, 투자, 트레이딩 또는 기타 유형의 조언이나 권장 사항으로 간주되지 않으며, 트레이딩뷰에서 제공하거나 보증하는 것이 아닙니다. 자세한 내용은 이용 약관을 참조하세요.
오픈 소스 스크립트
트레이딩뷰의 진정한 정신에 따라, 이 스크립트의 작성자는 이를 오픈소스로 공개하여 트레이더들이 기능을 검토하고 검증할 수 있도록 했습니다. 작성자에게 찬사를 보냅니다! 이 코드는 무료로 사용할 수 있지만, 코드를 재게시하는 경우 하우스 룰이 적용된다는 점을 기억하세요.
QuantumPips — Trade Structure. Not Noise.
Market Structure Pro (Invite-only): quantumpips.io/msp
Educational only. Not financial advice.
Market Structure Pro (Invite-only): quantumpips.io/msp
Educational only. Not financial advice.
면책사항
해당 정보와 게시물은 금융, 투자, 트레이딩 또는 기타 유형의 조언이나 권장 사항으로 간주되지 않으며, 트레이딩뷰에서 제공하거나 보증하는 것이 아닙니다. 자세한 내용은 이용 약관을 참조하세요.