OPEN-SOURCE SCRIPT
RSI Divergence Detector - HDAlgo
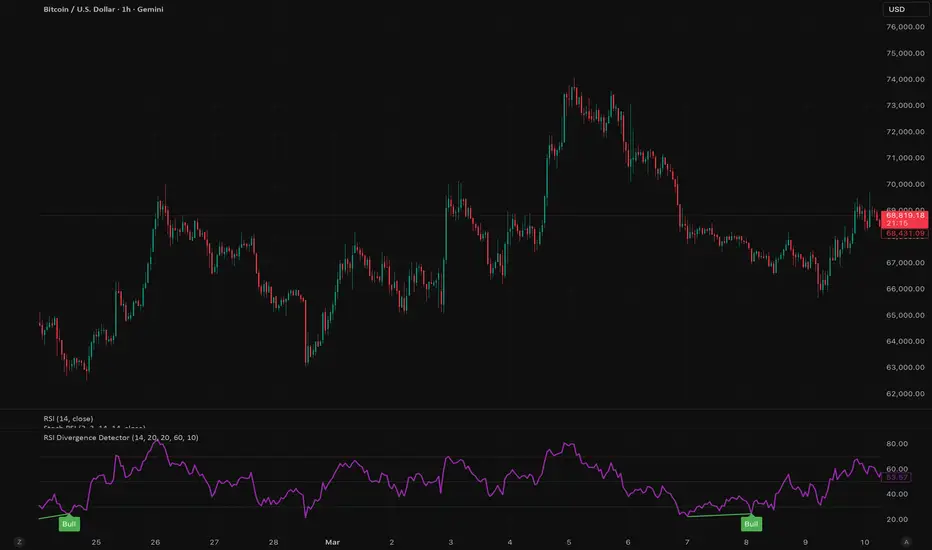
RSI Divergence Detector — Automatically Spot Reversal & Continuation Signals
This indicator automatically detects Regular and Hidden RSI Divergences and plots them directly on the RSI panel with visual lines and labels.
What It Detects
Regular Divergence (Reversal Signals):
Bullish Divergence — Price makes a lower low, but RSI makes a higher low. This signals weakening selling pressure and a potential reversal to the upside.
Bearish Divergence — Price makes a higher high, but RSI makes a lower high. This signals weakening buying pressure and a potential reversal to the downside.
Hidden Divergence (Trend Continuation Signals):
Hidden Bullish — Price makes a higher low, but RSI makes a lower low. Suggests the uptrend is likely to continue.
Hidden Bearish — Price makes a lower high, but RSI makes a higher high. Suggests the downtrend is likely to continue.
Visual Guide
🟢 Green label "Bull" + solid green line = Regular Bullish Divergence
🔴 Red label "Bear" + solid red line = Regular Bearish Divergence
🔺 Lime triangle + dashed line = Hidden Bullish Divergence
🔻 Orange triangle + dashed line = Hidden Bearish Divergence
Settings
RSI Length — Default 14. Standard RSI period.
Pivot Lookback Left / Right — Controls how significant a pivot must be. Higher = fewer but stronger signals.
Min / Max Bars Between Pivots — Filters out divergences that are too close or too far apart.
Show Bullish / Bearish / Hidden — Toggle each divergence type on or off.
How to Use
For reversals: Look for Regular Bullish Divergence near support zones or Regular Bearish Divergence near resistance zones.
For trend continuation: Enable Hidden Divergence to confirm that the current trend is still intact.
Best combined with: Stochastic crossover in oversold/overbought zones, volume confirmation, and key support/resistance levels from higher timeframes.
Alerts
Built-in alert conditions for all 4 divergence types — set them up via TradingView's alert menu so you never miss a signal.
Note: Divergence is not a standalone signal. Always confirm with price action, volume, and other confluence factors before entering a trade. This indicator has a natural delay of Pivot Lookback Right bars to confirm pivots.
This indicator automatically detects Regular and Hidden RSI Divergences and plots them directly on the RSI panel with visual lines and labels.
What It Detects
Regular Divergence (Reversal Signals):
Bullish Divergence — Price makes a lower low, but RSI makes a higher low. This signals weakening selling pressure and a potential reversal to the upside.
Bearish Divergence — Price makes a higher high, but RSI makes a lower high. This signals weakening buying pressure and a potential reversal to the downside.
Hidden Divergence (Trend Continuation Signals):
Hidden Bullish — Price makes a higher low, but RSI makes a lower low. Suggests the uptrend is likely to continue.
Hidden Bearish — Price makes a lower high, but RSI makes a higher high. Suggests the downtrend is likely to continue.
Visual Guide
🟢 Green label "Bull" + solid green line = Regular Bullish Divergence
🔴 Red label "Bear" + solid red line = Regular Bearish Divergence
🔺 Lime triangle + dashed line = Hidden Bullish Divergence
🔻 Orange triangle + dashed line = Hidden Bearish Divergence
Settings
RSI Length — Default 14. Standard RSI period.
Pivot Lookback Left / Right — Controls how significant a pivot must be. Higher = fewer but stronger signals.
Min / Max Bars Between Pivots — Filters out divergences that are too close or too far apart.
Show Bullish / Bearish / Hidden — Toggle each divergence type on or off.
How to Use
For reversals: Look for Regular Bullish Divergence near support zones or Regular Bearish Divergence near resistance zones.
For trend continuation: Enable Hidden Divergence to confirm that the current trend is still intact.
Best combined with: Stochastic crossover in oversold/overbought zones, volume confirmation, and key support/resistance levels from higher timeframes.
Alerts
Built-in alert conditions for all 4 divergence types — set them up via TradingView's alert menu so you never miss a signal.
Note: Divergence is not a standalone signal. Always confirm with price action, volume, and other confluence factors before entering a trade. This indicator has a natural delay of Pivot Lookback Right bars to confirm pivots.
오픈 소스 스크립트
트레이딩뷰의 진정한 정신에 따라, 이 스크립트의 작성자는 이를 오픈소스로 공개하여 트레이더들이 기능을 검토하고 검증할 수 있도록 했습니다. 작성자에게 찬사를 보냅니다! 이 코드는 무료로 사용할 수 있지만, 코드를 재게시하는 경우 하우스 룰이 적용된다는 점을 기억하세요.

면책사항
해당 정보와 게시물은 금융, 투자, 트레이딩 또는 기타 유형의 조언이나 권장 사항으로 간주되지 않으며, 트레이딩뷰에서 제공하거나 보증하는 것이 아닙니다. 자세한 내용은 이용 약관을 참조하세요.
오픈 소스 스크립트
트레이딩뷰의 진정한 정신에 따라, 이 스크립트의 작성자는 이를 오픈소스로 공개하여 트레이더들이 기능을 검토하고 검증할 수 있도록 했습니다. 작성자에게 찬사를 보냅니다! 이 코드는 무료로 사용할 수 있지만, 코드를 재게시하는 경우 하우스 룰이 적용된다는 점을 기억하세요.
면책사항
해당 정보와 게시물은 금융, 투자, 트레이딩 또는 기타 유형의 조언이나 권장 사항으로 간주되지 않으며, 트레이딩뷰에서 제공하거나 보증하는 것이 아닙니다. 자세한 내용은 이용 약관을 참조하세요.