Structure Break Pressure Oscillator
█ OVERVIEW
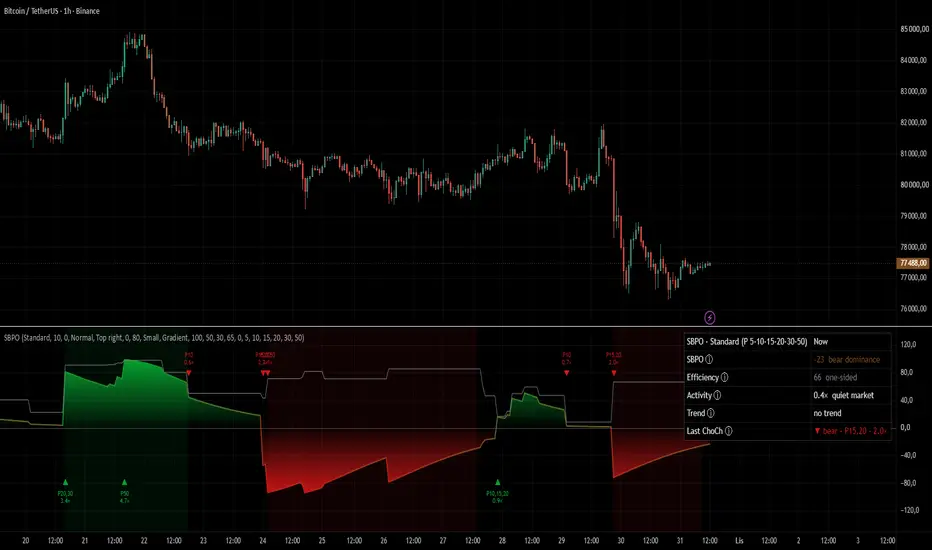
Structure Break Pressure Oscillator (SBPO) is a market structure analysis tool based on breaks of highs and lows across six scales at once. It does not tell you when to buy or sell. Instead, it shows which side of the market – buyers or sellers – breaks structure levels more often and with more force, whether that advantage is one-sided, whether the market is active, and where the first signs of a possible reversal appear.
The core of the indicator is an oscillator ranging from −100 to +100. Every break of a high earns points for the bulls, every break of a low – for the bears. The number of points depends on the scale of the level, the size of the move that built it, and how far beyond the level the candle closed. Points gradually lose significance over time, so the oscillator reflects the current balance of power rather than the entire chart history.
The picture is completed by: an efficiency line (whether breaks are one-sided), an assessment of market activity, a trend background, and ChoCh (Change of Character) markers with a strength rating. Optionally, the indicator takes volume and price gaps into account. A status table continuously gathers all readings in one place. The indicator can also color candles according to the SBPO value.
█ CONCEPTS
The indicator combines multi-scale market structure analysis (highs, lows, BoS and ChoCh), break weighting, decaying memory, normalization, and market regime assessment. A single level break does not create a signal – what matters is which side breaks more often, with more force, and on larger scales.
Structure scales
The indicator tracks highs and lows on six scales – from minor swings to the main structure. The scale is the number of bars on each side that must be lower (for a high) or higher (for a low). Example: a scale-20 high is the highest high among the 20 bars before it and the 20 bars after it.
Available profiles:
• Fast (3–30),
• Standard (5–50),
• Slow (10–100),
• Custom – your own scales (each can be disabled).
A level is registered only once it is confirmed, i.e. after a number of bars equal to the scale – so historical values never change.
BoS and ChoCh
On each scale the indicator maintains its own structure direction.
• BoS (Break of Structure) – a break in line with the current direction (a high in an uptrend, a low in a downtrend). It confirms continuation.
• ChoCh (Change of Character) – a break against the current direction (a high in a downtrend, a low in an uptrend). It signals a possible start of a reversal.
A break is counted on the candle close only – a wick piercing the level is not enough.
Break scoring
Each break receives a score that depends on:
• scale – a break of a scale-50 level weighs 10× more than a break of a scale-5 level,
• move size – for BoS, the impulse that built the level; for ChoCh, the depth of the move being reclaimed (both in ATR),
• break strength – the distance of the close beyond the level (in ATR),
• type – ChoCh receives a bonus over BoS,
• optionally volume – a high-volume candle earns more points, a low-volume one fewer.
The same move often breaks levels on several scales at once. To avoid counting it multiple times, only the highest score across all scales is taken on a given bar (separately for each direction).
Memory and the oscillator
Bull and bear points are accumulated and gradually decay. The "Memory" setting defines the decay rate – at 30, about 1/3 of a break's influence remains after 30 bars and about 1/7 after 60. A ChoCh additionally erodes the accumulated points of the opposite side (the larger the ChoCh scale, the stronger the effect), so the oscillator reacts faster to a change in market character.
The point difference is normalized against its typical range over the last 300 bars and mapped to the −100…+100 scale:
• above 0 – buyers have the advantage, below 0 – sellers,
• above +50 / below −50 – clear dominance (configurable level),
• a zero cross – control changes sides.
Efficiency and activity
Efficiency (0–100) shows whether breaks are one-sided:
• 80–100 – nearly all in the same direction, a clean trend,
• 35–65 – breaks in both directions, with a slight edge for one side,
• 0–35 – as many up as down, no direction.
Efficiency does not show direction – SBPO does.
Activity compares the current number and strength of breaks with their average level. 2.0× means twice as many as usual, 0.3× – the market is nearly idle.
Trend
The trend background appears when all of the following hold:
• efficiency exceeds the set threshold (65 by default),
• the market is active (activity of at least 0.5×),
• SBPO is on the same side of zero as the direction of breaks.
No background means no clear trend.
Signal strength
Strength compares the score of a break with the typical break on the chart (an average of about the last 50 breaks):
• about 1× – an average break,
• above 1.5× – strong,
• above 2.5× – very strong.
Price gaps
When price jumps over a level with a gap (a candle opens above the previous high or below the previous low), no trading took place at that level. Such a level earns no points and no ChoCh signal, but the structure direction is still updated. Optionally, all breaks can be muted for a set number of bars after a gap – useful for volatile session opens. ATR is calculated without gaps (an average of the high−low range), so session gaps do not inflate volatility.
Status table
The table continuously shows:
• profile and active scales,
• SBPO value with a dominance rating,
• efficiency (one-sided / mixed / two-sided),
• activity (quiet market / normal / high activity),
• trend state (uptrend / downtrend / no trend),
• the last ChoCh with its scales and strength.
Each row has a tooltip with an explanation.
█ FEATURES
• Structure analysis on six scales at once with Fast, Standard, Slow, and Custom profiles.
• Distinction between BoS and ChoCh breaks on each scale.
• Break scoring by scale, move size, close strength, and optionally volume.
• No double counting of the same move across scales.
• Decaying memory and erosion of the opposite side after a ChoCh.
• Oscillator normalized to the −100…+100 range.
• Efficiency line (0–100) and market activity rating.
• Trend background based on efficiency, activity, and SBPO side.
• ChoCh markers with scale and strength labels (e.g. "P20,30 / 1.8×").
• Signal filters: minimum scale, minimum strength, counter-dominance signals only.
• Price gap handling: ignoring skipped levels, muting after a gap, gap markers.
• Optional EMA line of the oscillator.
• Gradient fill, columns, or line only.
• Candle coloring by SBPO value.
• Dominance levels ±.
• Status table with tooltips.
• Additional values in the data window: bull and bear break strength, activity, raw points of both sides.
• Alerts: zero cross up and down, bullish and bearish ChoCh, trend start.
█ APPLICATIONS
Assessing market advantage
SBPO shows which side is winning the battle for structure levels. A value far from zero indicates clear dominance; oscillation around zero indicates a balance of power. Because larger scales weigh more, breaks of the main structure have more impact than minor swings.
Identifying trend and consolidation
High efficiency with normal or high activity indicates a clean, one-sided trend. Low efficiency indicates a market where breaks occur in both directions – typical of consolidation or a range. Low activity indicates a market where little is happening.
Early signs of a reversal
ChoCh markers show breaks against the current structure. The most informative are ChoCh events on larger scales, with high strength, and appearing against the dominant side (the "Counter-dominance signals only" option). A zero cross of SBPO confirms that control has actually shifted to the other side.
Assessing break quality
Signal strength makes it possible to distinguish a weak break, with a close just beyond the level, from a decisive break of a larger move on a higher scale. Optional volume further strengthens breaks backed by market participation.
Example of use
SBPO is best treated as a tool that describes the balance of power in market structure rather than as an entry-signal generator. Before making a decision it is worth taking into account:
• the value and side of SBPO,
• efficiency and activity,
• the presence of the trend background,
• the scale and strength of the last ChoCh,
• any price gaps,
• the broader price context and higher timeframes.
The status table allows you to continuously assess the state of the market without having to interpret the oscillator itself.
█ NOTES
• The indicator does not repaint history. Highs and lows are registered with a delay equal to the scale (e.g. a scale-20 level – after 20 bars), and markers and alerts appear on confirmed bars only.
• A break counts only on the candle close – wicks are not taken into account.
• The oscillator needs about 300 bars of history for normalization – it is not displayed before that.
• Each scale tracks up to 20 unbroken levels per side; the oldest are removed first.
• Smaller scales contribute to the SBPO line but by default do not generate ChoCh markers, because they are too noisy.
• On forex and CFDs volume data can be unreliable – it is worth disabling the volume option there. Gaps occur mainly on stocks and futures; they are rare on forex and crypto.
• Candle coloring overrides the colors set on the chart – when disabled, the default colors return.
Structure Break Pressure Oscillator (SBPO) is a market structure analysis tool based on breaks of highs and lows across six scales at once. It does not tell you when to buy or sell. Instead, it shows which side of the market – buyers or sellers – breaks structure levels more often and with more force, whether that advantage is one-sided, whether the market is active, and where the first signs of a possible reversal appear.
The core of the indicator is an oscillator ranging from −100 to +100. Every break of a high earns points for the bulls, every break of a low – for the bears. The number of points depends on the scale of the level, the size of the move that built it, and how far beyond the level the candle closed. Points gradually lose significance over time, so the oscillator reflects the current balance of power rather than the entire chart history.
The picture is completed by: an efficiency line (whether breaks are one-sided), an assessment of market activity, a trend background, and ChoCh (Change of Character) markers with a strength rating. Optionally, the indicator takes volume and price gaps into account. A status table continuously gathers all readings in one place. The indicator can also color candles according to the SBPO value.
█ CONCEPTS
The indicator combines multi-scale market structure analysis (highs, lows, BoS and ChoCh), break weighting, decaying memory, normalization, and market regime assessment. A single level break does not create a signal – what matters is which side breaks more often, with more force, and on larger scales.
Structure scales
The indicator tracks highs and lows on six scales – from minor swings to the main structure. The scale is the number of bars on each side that must be lower (for a high) or higher (for a low). Example: a scale-20 high is the highest high among the 20 bars before it and the 20 bars after it.
Available profiles:
• Fast (3–30),
• Standard (5–50),
• Slow (10–100),
• Custom – your own scales (each can be disabled).
A level is registered only once it is confirmed, i.e. after a number of bars equal to the scale – so historical values never change.
BoS and ChoCh
On each scale the indicator maintains its own structure direction.
• BoS (Break of Structure) – a break in line with the current direction (a high in an uptrend, a low in a downtrend). It confirms continuation.
• ChoCh (Change of Character) – a break against the current direction (a high in a downtrend, a low in an uptrend). It signals a possible start of a reversal.
A break is counted on the candle close only – a wick piercing the level is not enough.
Break scoring
Each break receives a score that depends on:
• scale – a break of a scale-50 level weighs 10× more than a break of a scale-5 level,
• move size – for BoS, the impulse that built the level; for ChoCh, the depth of the move being reclaimed (both in ATR),
• break strength – the distance of the close beyond the level (in ATR),
• type – ChoCh receives a bonus over BoS,
• optionally volume – a high-volume candle earns more points, a low-volume one fewer.
The same move often breaks levels on several scales at once. To avoid counting it multiple times, only the highest score across all scales is taken on a given bar (separately for each direction).
Memory and the oscillator
Bull and bear points are accumulated and gradually decay. The "Memory" setting defines the decay rate – at 30, about 1/3 of a break's influence remains after 30 bars and about 1/7 after 60. A ChoCh additionally erodes the accumulated points of the opposite side (the larger the ChoCh scale, the stronger the effect), so the oscillator reacts faster to a change in market character.
The point difference is normalized against its typical range over the last 300 bars and mapped to the −100…+100 scale:
• above 0 – buyers have the advantage, below 0 – sellers,
• above +50 / below −50 – clear dominance (configurable level),
• a zero cross – control changes sides.
Efficiency and activity
Efficiency (0–100) shows whether breaks are one-sided:
• 80–100 – nearly all in the same direction, a clean trend,
• 35–65 – breaks in both directions, with a slight edge for one side,
• 0–35 – as many up as down, no direction.
Efficiency does not show direction – SBPO does.
Activity compares the current number and strength of breaks with their average level. 2.0× means twice as many as usual, 0.3× – the market is nearly idle.
Trend
The trend background appears when all of the following hold:
• efficiency exceeds the set threshold (65 by default),
• the market is active (activity of at least 0.5×),
• SBPO is on the same side of zero as the direction of breaks.
No background means no clear trend.
Signal strength
Strength compares the score of a break with the typical break on the chart (an average of about the last 50 breaks):
• about 1× – an average break,
• above 1.5× – strong,
• above 2.5× – very strong.
Price gaps
When price jumps over a level with a gap (a candle opens above the previous high or below the previous low), no trading took place at that level. Such a level earns no points and no ChoCh signal, but the structure direction is still updated. Optionally, all breaks can be muted for a set number of bars after a gap – useful for volatile session opens. ATR is calculated without gaps (an average of the high−low range), so session gaps do not inflate volatility.
Status table
The table continuously shows:
• profile and active scales,
• SBPO value with a dominance rating,
• efficiency (one-sided / mixed / two-sided),
• activity (quiet market / normal / high activity),
• trend state (uptrend / downtrend / no trend),
• the last ChoCh with its scales and strength.
Each row has a tooltip with an explanation.
█ FEATURES
• Structure analysis on six scales at once with Fast, Standard, Slow, and Custom profiles.
• Distinction between BoS and ChoCh breaks on each scale.
• Break scoring by scale, move size, close strength, and optionally volume.
• No double counting of the same move across scales.
• Decaying memory and erosion of the opposite side after a ChoCh.
• Oscillator normalized to the −100…+100 range.
• Efficiency line (0–100) and market activity rating.
• Trend background based on efficiency, activity, and SBPO side.
• ChoCh markers with scale and strength labels (e.g. "P20,30 / 1.8×").
• Signal filters: minimum scale, minimum strength, counter-dominance signals only.
• Price gap handling: ignoring skipped levels, muting after a gap, gap markers.
• Optional EMA line of the oscillator.
• Gradient fill, columns, or line only.
• Candle coloring by SBPO value.
• Dominance levels ±.
• Status table with tooltips.
• Additional values in the data window: bull and bear break strength, activity, raw points of both sides.
• Alerts: zero cross up and down, bullish and bearish ChoCh, trend start.
█ APPLICATIONS
Assessing market advantage
SBPO shows which side is winning the battle for structure levels. A value far from zero indicates clear dominance; oscillation around zero indicates a balance of power. Because larger scales weigh more, breaks of the main structure have more impact than minor swings.
Identifying trend and consolidation
High efficiency with normal or high activity indicates a clean, one-sided trend. Low efficiency indicates a market where breaks occur in both directions – typical of consolidation or a range. Low activity indicates a market where little is happening.
Early signs of a reversal
ChoCh markers show breaks against the current structure. The most informative are ChoCh events on larger scales, with high strength, and appearing against the dominant side (the "Counter-dominance signals only" option). A zero cross of SBPO confirms that control has actually shifted to the other side.
Assessing break quality
Signal strength makes it possible to distinguish a weak break, with a close just beyond the level, from a decisive break of a larger move on a higher scale. Optional volume further strengthens breaks backed by market participation.
Example of use
SBPO is best treated as a tool that describes the balance of power in market structure rather than as an entry-signal generator. Before making a decision it is worth taking into account:
• the value and side of SBPO,
• efficiency and activity,
• the presence of the trend background,
• the scale and strength of the last ChoCh,
• any price gaps,
• the broader price context and higher timeframes.
The status table allows you to continuously assess the state of the market without having to interpret the oscillator itself.
█ NOTES
• The indicator does not repaint history. Highs and lows are registered with a delay equal to the scale (e.g. a scale-20 level – after 20 bars), and markers and alerts appear on confirmed bars only.
• A break counts only on the candle close – wicks are not taken into account.
• The oscillator needs about 300 bars of history for normalization – it is not displayed before that.
• Each scale tracks up to 20 unbroken levels per side; the oldest are removed first.
• Smaller scales contribute to the SBPO line but by default do not generate ChoCh markers, because they are too noisy.
• On forex and CFDs volume data can be unreliable – it is worth disabling the volume option there. Gaps occur mainly on stocks and futures; they are rare on forex and crypto.
• Candle coloring overrides the colors set on the chart – when disabled, the default colors return.

면책사항
해당 정보와 게시물은 금융, 투자, 트레이딩 또는 기타 유형의 조언이나 권장 사항으로 간주되지 않으며, 트레이딩뷰에서 제공하거나 보증하는 것이 아닙니다. 자세한 내용은 이용 약관을 참조하세요.
면책사항
해당 정보와 게시물은 금융, 투자, 트레이딩 또는 기타 유형의 조언이나 권장 사항으로 간주되지 않으며, 트레이딩뷰에서 제공하거나 보증하는 것이 아닙니다. 자세한 내용은 이용 약관을 참조하세요.