OPEN-SOURCE SCRIPT
업데이트됨 Hourly Inflection Levels/ pivot points
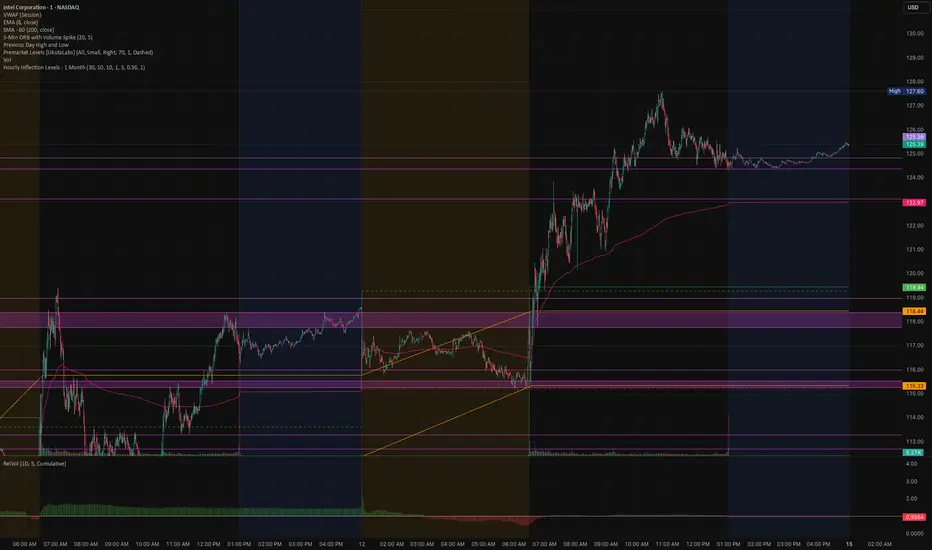
This indicator finds the price levels where the hourly chart has repeatedly turned, and draws them as support/resistance zones — regardless of what timeframe your chart is on. It pulls 1-hour data via request.security, so the same zones appear whether you're viewing a 5-minute, 1-hour, or 4-hour chart.
How it works
1. Pivot detection. On the hourly series it locates two kinds of turning points:
Wick pivots — pivot highs/lows based on candle high/low (where price actually reached).
Body pivots — pivot highs/lows based on max(open, close) / min(open, close) (where price closed the swing).
2. Intensity filter. Each pivot is scored by how far price travelled inside its pivot window (the displacement between the pivot and the opposite extreme). Weak, shallow pivots are discarded via the Min Inflection Intensity threshold, so only meaningful inflections survive.
3. Cross-type merging into zones. Every qualified pivot — wick or body, high or low — is pooled together, sorted by price, and merged: any pivots within the Merge / Zone Tolerance of each other collapse into a single zone. The zone's boundaries become the highest and lowest merged price; each merge adds one to the zone's touch count, and the zone keeps the strongest intensity of its members.
4. Display. Zones that have been touched at least Min Touch Count times are drawn as boxes, optionally extended to the right, with a label showing the level's mid-price, touch count, and intensity %. Levels touched fewer times are hidden.
Inputs
Lookback Period — how many days of hourly history to scan (rolling window; old levels are pruned automatically).
Pivot Left/Right Bars — sensitivity of pivot detection.
Min Touch Count — how many pivots must fall in a zone for it to be shown.
Min Inflection Intensity — minimum swing strength for a pivot to count.
Merge / Zone Tolerance — how close pivots must be to merge into one zone.
Wick / Body toggles — choose which pivot types feed the zones.
Display — extend zones right, show labels, zone color, border width.
Reading the zones
A zone with a high touch count and high intensity marks a price area the market has reacted to strongly and repeatedly over the past month — prime candidates for support, resistance, and reaction levels.
Note: Zones are confluence levels built from past hourly pivots, not signals. They don't repaint historically (pivots are confirmed), but the active set updates as new hourly bars form and old ones age out of the lookback window.
How it works
1. Pivot detection. On the hourly series it locates two kinds of turning points:
Wick pivots — pivot highs/lows based on candle high/low (where price actually reached).
Body pivots — pivot highs/lows based on max(open, close) / min(open, close) (where price closed the swing).
2. Intensity filter. Each pivot is scored by how far price travelled inside its pivot window (the displacement between the pivot and the opposite extreme). Weak, shallow pivots are discarded via the Min Inflection Intensity threshold, so only meaningful inflections survive.
3. Cross-type merging into zones. Every qualified pivot — wick or body, high or low — is pooled together, sorted by price, and merged: any pivots within the Merge / Zone Tolerance of each other collapse into a single zone. The zone's boundaries become the highest and lowest merged price; each merge adds one to the zone's touch count, and the zone keeps the strongest intensity of its members.
4. Display. Zones that have been touched at least Min Touch Count times are drawn as boxes, optionally extended to the right, with a label showing the level's mid-price, touch count, and intensity %. Levels touched fewer times are hidden.
Inputs
Lookback Period — how many days of hourly history to scan (rolling window; old levels are pruned automatically).
Pivot Left/Right Bars — sensitivity of pivot detection.
Min Touch Count — how many pivots must fall in a zone for it to be shown.
Min Inflection Intensity — minimum swing strength for a pivot to count.
Merge / Zone Tolerance — how close pivots must be to merge into one zone.
Wick / Body toggles — choose which pivot types feed the zones.
Display — extend zones right, show labels, zone color, border width.
Reading the zones
A zone with a high touch count and high intensity marks a price area the market has reacted to strongly and repeatedly over the past month — prime candidates for support, resistance, and reaction levels.
Note: Zones are confluence levels built from past hourly pivots, not signals. They don't repaint historically (pivots are confirmed), but the active set updates as new hourly bars form and old ones age out of the lookback window.
릴리즈 노트
This indicator finds the price levels where the hourly chart has repeatedly turned, and draws them as support/resistance zones — regardless of what timeframe your chart is on. It pulls 1-hour data via request.security, so the same zones appear whether you're viewing a 5-minute, 1-hour, or 4-hour chart.How it works
1. Pivot detection. On the hourly series it locates two kinds of turning points:
Wick pivots — pivot highs/lows based on candle high/low (where price actually reached).
Body pivots — pivot highs/lows based on max(open, close) / min(open, close) (where price closed the swing).
2. Intensity filter. Each pivot is scored by how far price travelled inside its pivot window (the displacement between the pivot and the opposite extreme). Weak, shallow pivots are discarded via the Min Inflection Intensity threshold, so only meaningful inflections survive.
3. Cross-type merging into zones. Every qualified pivot — wick or body, high or low — is pooled together, sorted by price, and merged: any pivots within the Merge / Zone Tolerance of each other collapse into a single zone. The zone's boundaries become the highest and lowest merged price; each merge adds one to the zone's touch count, and the zone keeps the strongest intensity of its members.
4. Display. Zones that have been touched at least Min Touch Count times are drawn as boxes, optionally extended to the right, with a label showing the level's mid-price, touch count, and intensity %. Levels touched fewer times are hidden.
Inputs
Lookback Period — how many days of hourly history to scan (rolling window; old levels are pruned automatically).
Pivot Left/Right Bars — sensitivity of pivot detection.
Min Touch Count — how many pivots must fall in a zone for it to be shown.
Min Inflection Intensity — minimum swing strength for a pivot to count.
Merge / Zone Tolerance — how close pivots must be to merge into one zone.
Wick / Body toggles — choose which pivot types feed the zones.
Display — extend zones right, show labels, zone color, border width.
Reading the zones
A zone with a high touch count and high intensity marks a price area the market has reacted to strongly and repeatedly over the past month — prime candidates for support, resistance, and reaction levels.
Note: Zones are confluence levels built from past hourly pivots, not signals. They don't repaint historically (pivots are confirmed), but the active set updates as new hourly bars form and old ones age out of the lookback window.
릴리즈 노트
Change include option to auto calcuate the intensity threshold based on ATR of a tickr오픈 소스 스크립트
트레이딩뷰의 진정한 정신에 따라, 이 스크립트의 작성자는 이를 오픈소스로 공개하여 트레이더들이 기능을 검토하고 검증할 수 있도록 했습니다. 작성자에게 찬사를 보냅니다! 이 코드는 무료로 사용할 수 있지만, 코드를 재게시하는 경우 하우스 룰이 적용된다는 점을 기억하세요.

면책사항
해당 정보와 게시물은 금융, 투자, 트레이딩 또는 기타 유형의 조언이나 권장 사항으로 간주되지 않으며, 트레이딩뷰에서 제공하거나 보증하는 것이 아닙니다. 자세한 내용은 이용 약관을 참조하세요.
오픈 소스 스크립트
트레이딩뷰의 진정한 정신에 따라, 이 스크립트의 작성자는 이를 오픈소스로 공개하여 트레이더들이 기능을 검토하고 검증할 수 있도록 했습니다. 작성자에게 찬사를 보냅니다! 이 코드는 무료로 사용할 수 있지만, 코드를 재게시하는 경우 하우스 룰이 적용된다는 점을 기억하세요.
면책사항
해당 정보와 게시물은 금융, 투자, 트레이딩 또는 기타 유형의 조언이나 권장 사항으로 간주되지 않으며, 트레이딩뷰에서 제공하거나 보증하는 것이 아닙니다. 자세한 내용은 이용 약관을 참조하세요.