업데이트됨
Stock Fundamental Performance:EPS and Revenue growth [Dots3Red]
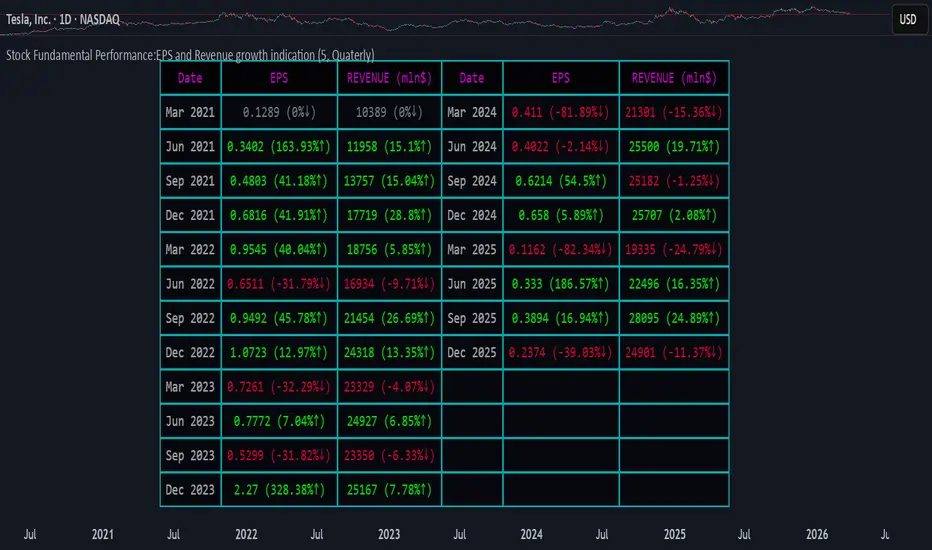
This indicator provides a clear and intuitive overview of a company’s revenue and EPS growth, helping you quickly evaluate its financial performance over time.
All data is displayed in a clean, easy-to-read table below the main chart, so you can analyze fundamentals without cluttering price action.
The indicator supports both annual and quarterly data, making it suitable for long-term investors and short-term traders alike.
In addition to raw values, it also shows the percentage change relative to the previous period, allowing you to instantly identify acceleration or deceleration in growth.
To improve visual clarity:
This color-coded system makes trend changes immediately visible at a glance.

How to use
By default, the table displays annual data for the last 5 years, offering a long-term perspective on company growth.
You can switch to quarterly data in the settings for a more granular analysis.
Limitations
Due to Pine Engine data request constraints, quarterly data is limited to a maximum lookback of 5 years.
Selecting a longer quarterly period may cause the data to appear out of chronological order. We are actively working on improvements to address this in future updates.
All data is displayed in a clean, easy-to-read table below the main chart, so you can analyze fundamentals without cluttering price action.
The indicator supports both annual and quarterly data, making it suitable for long-term investors and short-term traders alike.
In addition to raw values, it also shows the percentage change relative to the previous period, allowing you to instantly identify acceleration or deceleration in growth.
To improve visual clarity:
- Green values indicate an increase compared to the previous period
- Red values indicate a decrease compared to the previous period
This color-coded system makes trend changes immediately visible at a glance.
How to use
By default, the table displays annual data for the last 5 years, offering a long-term perspective on company growth.
You can switch to quarterly data in the settings for a more granular analysis.
Limitations
Due to Pine Engine data request constraints, quarterly data is limited to a maximum lookback of 5 years.
Selecting a longer quarterly period may cause the data to appear out of chronological order. We are actively working on improvements to address this in future updates.
릴리즈 노트
Updated the colour scheme릴리즈 노트
Updated the colour scheme
Connect the dots to elevate your trading.
면책사항
해당 정보와 게시물은 금융, 투자, 트레이딩 또는 기타 유형의 조언이나 권장 사항으로 간주되지 않으며, 트레이딩뷰에서 제공하거나 보증하는 것이 아닙니다. 자세한 내용은 이용 약관을 참조하세요.
Connect the dots to elevate your trading.
면책사항
해당 정보와 게시물은 금융, 투자, 트레이딩 또는 기타 유형의 조언이나 권장 사항으로 간주되지 않으며, 트레이딩뷰에서 제공하거나 보증하는 것이 아닙니다. 자세한 내용은 이용 약관을 참조하세요.