OPEN-SOURCE SCRIPT
SMC Level Analyzer
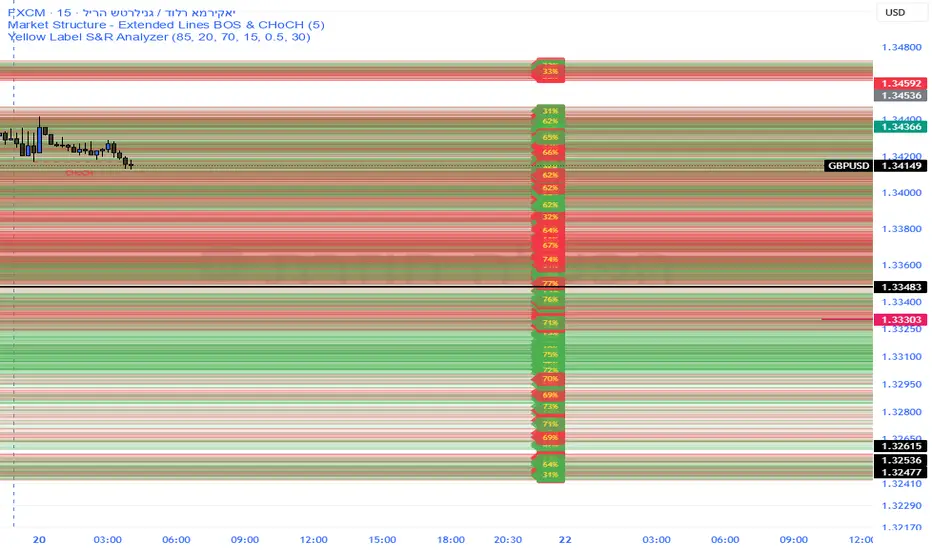
Precision S&R Strength – Indicator Description
Overview
The Precision S&R Strength analyzer is a sophisticated technical tool designed to identify and quantify the importance of Support and Resistance levels. Unlike standard pivot-point indicators, this script calculates a dynamic strength percentage for each level based on historical price interaction and accumulated trading volume.
Core Functionality
Smart Level Detection: Automatically identifies key high and low pivot points.
Volume & Touch Analysis: Each level is back-tested against the last 300 candles. The strength percentage (displayed on the right margin) is a weighted calculation of how many times the price reacted to the zone and the volume transacted at those prices.
Supply & Demand Zones: Visualizes levels as horizontal "boxes" (Zones) rather than simple lines, representing the actual price range where orders are clustered.
Clean Visuals: All data labels are anchored to the right-side margin, keeping the main chart clean and focused on price movement.
Strategic Purpose & Risk Warning
CRITICAL: This indicator is NOT a standalone "Buy/Sell" signal generator.
The primary goal of this tool is to act as a Confluence Factor (Secondary Confirmation) for your trading strategy. To trade successfully with this indicator, you must:
Analyze Price Action: Look for candlestick patterns (like pin bars or engulfing candles) near the highlighted zones.
Follow the Trend: Always align your trades with the overall market structure (Order Flow). A "90% strength" resistance level is more likely to break if the macro trend is strongly bullish.
Use as Confirmation: Use the strength percentage to filter out "weak" levels and focus only on high-probability zones where smart money has previously shown interest.
Trading involves significant risk. Never rely solely on a single indicator for execution.
Overview
The Precision S&R Strength analyzer is a sophisticated technical tool designed to identify and quantify the importance of Support and Resistance levels. Unlike standard pivot-point indicators, this script calculates a dynamic strength percentage for each level based on historical price interaction and accumulated trading volume.
Core Functionality
Smart Level Detection: Automatically identifies key high and low pivot points.
Volume & Touch Analysis: Each level is back-tested against the last 300 candles. The strength percentage (displayed on the right margin) is a weighted calculation of how many times the price reacted to the zone and the volume transacted at those prices.
Supply & Demand Zones: Visualizes levels as horizontal "boxes" (Zones) rather than simple lines, representing the actual price range where orders are clustered.
Clean Visuals: All data labels are anchored to the right-side margin, keeping the main chart clean and focused on price movement.
Strategic Purpose & Risk Warning
CRITICAL: This indicator is NOT a standalone "Buy/Sell" signal generator.
The primary goal of this tool is to act as a Confluence Factor (Secondary Confirmation) for your trading strategy. To trade successfully with this indicator, you must:
Analyze Price Action: Look for candlestick patterns (like pin bars or engulfing candles) near the highlighted zones.
Follow the Trend: Always align your trades with the overall market structure (Order Flow). A "90% strength" resistance level is more likely to break if the macro trend is strongly bullish.
Use as Confirmation: Use the strength percentage to filter out "weak" levels and focus only on high-probability zones where smart money has previously shown interest.
Trading involves significant risk. Never rely solely on a single indicator for execution.
오픈 소스 스크립트
트레이딩뷰의 진정한 정신에 따라, 이 스크립트의 작성자는 이를 오픈소스로 공개하여 트레이더들이 기능을 검토하고 검증할 수 있도록 했습니다. 작성자에게 찬사를 보냅니다! 이 코드는 무료로 사용할 수 있지만, 코드를 재게시하는 경우 하우스 룰이 적용된다는 점을 기억하세요.

면책사항
해당 정보와 게시물은 금융, 투자, 트레이딩 또는 기타 유형의 조언이나 권장 사항으로 간주되지 않으며, 트레이딩뷰에서 제공하거나 보증하는 것이 아닙니다. 자세한 내용은 이용 약관을 참조하세요.
오픈 소스 스크립트
트레이딩뷰의 진정한 정신에 따라, 이 스크립트의 작성자는 이를 오픈소스로 공개하여 트레이더들이 기능을 검토하고 검증할 수 있도록 했습니다. 작성자에게 찬사를 보냅니다! 이 코드는 무료로 사용할 수 있지만, 코드를 재게시하는 경우 하우스 룰이 적용된다는 점을 기억하세요.
면책사항
해당 정보와 게시물은 금융, 투자, 트레이딩 또는 기타 유형의 조언이나 권장 사항으로 간주되지 않으며, 트레이딩뷰에서 제공하거나 보증하는 것이 아닙니다. 자세한 내용은 이용 약관을 참조하세요.