OPEN-SOURCE SCRIPT
EMA 30/50/100 Long Entries + MTF Trend
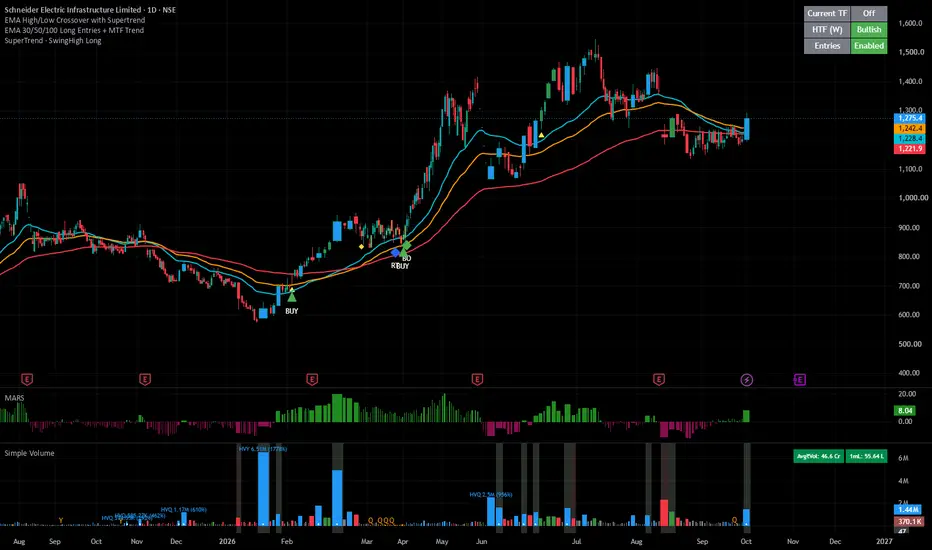
# EMA 30/50/100 Long Entries + MTF Trend
A long-only trend-following indicator that combines a 30/50/100 EMA stack with two entry triggers (breakout and retest) and an optional higher-timeframe trend filter. It was designed with Indian equities (NSE/BSE) in mind, but it works on any symbol and timeframe.
## How it works
### 1. Setup (yellow diamond)
A setup forms on the bar where all of these become true:
- The 30 EMA is above the 50 EMA
- The 30 EMA is above the 100 EMA
- The 50 EMA is above the 100 EMA
The setup stays active until the EMA stack loses alignment. While it is active, the background is shaded green if the trend filters pass.
### 2. Entry A: Breakout (green "BO" label)
While a setup is active, a Breakout fires when the close is above the highest high of the previous N bars (default 10).
### 3. Entry B: Retest (blue "RT" label)
While a setup is active:
- A candle dips to or below any of the three EMAs but closes back above it.
- The next candle closes above that candle's high, which confirms the bounce.
Each entry type fires only once per setup, so you do not get repeated signals in the same trend. The flags reset when a new setup forms.
## Trend filters
### Higher timeframe filter (on by default)
The higher timeframe is bullish when its last completed close is above its 30 EMA and its 30 EMA is above its 50 EMA. The higher timeframe is chosen automatically:
| Chart timeframe | Higher timeframe |
|---|---|
| 1 minute or lower | 5 minutes |
| 5 minutes | 15 minutes |
| 15 minutes | 1 hour |
| 1 hour to 4 hours | Daily |
| Daily | Weekly |
| Weekly and above | Monthly |
You can override this in the settings. The filter reads the last completed higher-timeframe bar, so it does not repaint. On a Daily chart, the weekly reading can lag by up to one week.
### Current timeframe filter (off by default)
Requires price to be above a rising 100 EMA. The EMA alignment already implies most of this, so it is optional.
### New listings
If a symbol does not have enough higher-timeframe history (about 50 bars), the higher-timeframe filter passes by default so recent IPOs are not blocked. You can turn this off in the settings.
## Inputs
| Input | Default | Description |
|---|---|---|
| Breakout lookback (bars) | 10 | Number of previous bars used to find the prior high |
| Use higher timeframe filter | On | Requires a bullish higher timeframe for entries |
| Use current timeframe filter | Off | Requires price above a rising 100 EMA |
| Pass HTF filter if not enough history | On | Lets new listings through |
| Slope lookback | 5 | Bars used to measure the 100 EMA slope (current timeframe filter) |
| Higher timeframe | Auto | Auto, 5, 15, 60, D, W or M |
## Visuals
- **EMAs:** 30 (aqua), 50 (orange), 100 (red)
- **Yellow diamond:** Setup formed
- **BO / RT labels:** Breakout and Retest entries
- **Green background:** Setup active and trend filters passing
- **Status table (top right):** Current timeframe state, higher-timeframe state, and whether entries are enabled or blocked
## Alerts
Four alert conditions are available:
- Setup Happened
- Setup Happened + Trend OK
- Long Entry - Breakout
- Long Entry - Retest
Alert messages include the symbol and timeframe. For best results, set the alert trigger to "Once Per Bar Close" so signals are confirmed.
## Screening
Three plots are available in the Data Window for use as columns or filters in the Pine Screener (1 = true, 0 = false):
- Setup
- Setup + Trend OK
- Setup Active
## Suggested use
- **Swing trading:** Daily chart (Weekly filter)
- **Intraday:** 15-minute chart (1-hour filter)
## Notes and limitations
- Long entries only. There are no exit rules, stop losses or targets. Manage risk with your own plan.
- The higher-timeframe filter intentionally uses completed bars to avoid repainting, which adds some delay.
- The strategy is EMA-based and lags price. It performs best in trending markets and can produce false signals in sideways markets.
- Results depend on the symbol, timeframe and period. Test it on your own instruments before using it.
## Disclaimer
This indicator is for educational and informational purposes only and is not financial advice. Trading involves risk, and past performance does not guarantee future results.
A long-only trend-following indicator that combines a 30/50/100 EMA stack with two entry triggers (breakout and retest) and an optional higher-timeframe trend filter. It was designed with Indian equities (NSE/BSE) in mind, but it works on any symbol and timeframe.
## How it works
### 1. Setup (yellow diamond)
A setup forms on the bar where all of these become true:
- The 30 EMA is above the 50 EMA
- The 30 EMA is above the 100 EMA
- The 50 EMA is above the 100 EMA
The setup stays active until the EMA stack loses alignment. While it is active, the background is shaded green if the trend filters pass.
### 2. Entry A: Breakout (green "BO" label)
While a setup is active, a Breakout fires when the close is above the highest high of the previous N bars (default 10).
### 3. Entry B: Retest (blue "RT" label)
While a setup is active:
- A candle dips to or below any of the three EMAs but closes back above it.
- The next candle closes above that candle's high, which confirms the bounce.
Each entry type fires only once per setup, so you do not get repeated signals in the same trend. The flags reset when a new setup forms.
## Trend filters
### Higher timeframe filter (on by default)
The higher timeframe is bullish when its last completed close is above its 30 EMA and its 30 EMA is above its 50 EMA. The higher timeframe is chosen automatically:
| Chart timeframe | Higher timeframe |
|---|---|
| 1 minute or lower | 5 minutes |
| 5 minutes | 15 minutes |
| 15 minutes | 1 hour |
| 1 hour to 4 hours | Daily |
| Daily | Weekly |
| Weekly and above | Monthly |
You can override this in the settings. The filter reads the last completed higher-timeframe bar, so it does not repaint. On a Daily chart, the weekly reading can lag by up to one week.
### Current timeframe filter (off by default)
Requires price to be above a rising 100 EMA. The EMA alignment already implies most of this, so it is optional.
### New listings
If a symbol does not have enough higher-timeframe history (about 50 bars), the higher-timeframe filter passes by default so recent IPOs are not blocked. You can turn this off in the settings.
## Inputs
| Input | Default | Description |
|---|---|---|
| Breakout lookback (bars) | 10 | Number of previous bars used to find the prior high |
| Use higher timeframe filter | On | Requires a bullish higher timeframe for entries |
| Use current timeframe filter | Off | Requires price above a rising 100 EMA |
| Pass HTF filter if not enough history | On | Lets new listings through |
| Slope lookback | 5 | Bars used to measure the 100 EMA slope (current timeframe filter) |
| Higher timeframe | Auto | Auto, 5, 15, 60, D, W or M |
## Visuals
- **EMAs:** 30 (aqua), 50 (orange), 100 (red)
- **Yellow diamond:** Setup formed
- **BO / RT labels:** Breakout and Retest entries
- **Green background:** Setup active and trend filters passing
- **Status table (top right):** Current timeframe state, higher-timeframe state, and whether entries are enabled or blocked
## Alerts
Four alert conditions are available:
- Setup Happened
- Setup Happened + Trend OK
- Long Entry - Breakout
- Long Entry - Retest
Alert messages include the symbol and timeframe. For best results, set the alert trigger to "Once Per Bar Close" so signals are confirmed.
## Screening
Three plots are available in the Data Window for use as columns or filters in the Pine Screener (1 = true, 0 = false):
- Setup
- Setup + Trend OK
- Setup Active
## Suggested use
- **Swing trading:** Daily chart (Weekly filter)
- **Intraday:** 15-minute chart (1-hour filter)
## Notes and limitations
- Long entries only. There are no exit rules, stop losses or targets. Manage risk with your own plan.
- The higher-timeframe filter intentionally uses completed bars to avoid repainting, which adds some delay.
- The strategy is EMA-based and lags price. It performs best in trending markets and can produce false signals in sideways markets.
- Results depend on the symbol, timeframe and period. Test it on your own instruments before using it.
## Disclaimer
This indicator is for educational and informational purposes only and is not financial advice. Trading involves risk, and past performance does not guarantee future results.
오픈 소스 스크립트
트레이딩뷰의 진정한 정신에 따라, 이 스크립트의 작성자는 이를 오픈소스로 공개하여 트레이더들이 기능을 검토하고 검증할 수 있도록 했습니다. 작성자에게 찬사를 보냅니다! 이 코드는 무료로 사용할 수 있지만, 코드를 재게시하는 경우 하우스 룰이 적용된다는 점을 기억하세요.

면책사항
해당 정보와 게시물은 금융, 투자, 트레이딩 또는 기타 유형의 조언이나 권장 사항으로 간주되지 않으며, 트레이딩뷰에서 제공하거나 보증하는 것이 아닙니다. 자세한 내용은 이용 약관을 참조하세요.
오픈 소스 스크립트
트레이딩뷰의 진정한 정신에 따라, 이 스크립트의 작성자는 이를 오픈소스로 공개하여 트레이더들이 기능을 검토하고 검증할 수 있도록 했습니다. 작성자에게 찬사를 보냅니다! 이 코드는 무료로 사용할 수 있지만, 코드를 재게시하는 경우 하우스 룰이 적용된다는 점을 기억하세요.
면책사항
해당 정보와 게시물은 금융, 투자, 트레이딩 또는 기타 유형의 조언이나 권장 사항으로 간주되지 않으며, 트레이딩뷰에서 제공하거나 보증하는 것이 아닙니다. 자세한 내용은 이용 약관을 참조하세요.