OPEN-SOURCE SCRIPT
업데이트됨 Dimensional Support Resistance
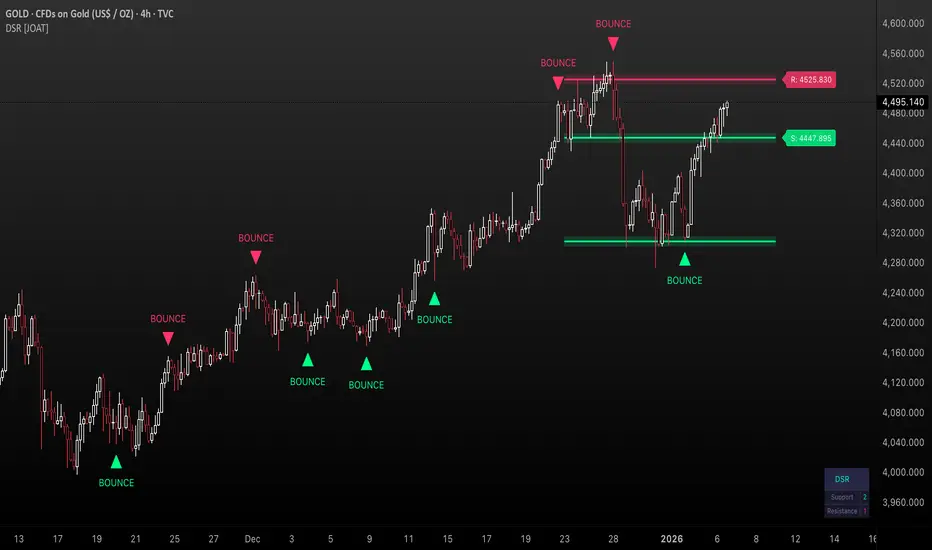
Dimensional Support Resistance [JOAT]
Overview
Dimensional Support Resistance is an open-source overlay indicator that automatically detects and displays clean, non-overlapping support and resistance levels using pivot-based analysis with intelligent filtering. It identifies significant swing highs and lows, filters them by minimum distance to prevent visual clutter, and provides volume-confirmed bounce signals.
What This Indicator Does
The indicator calculates and displays:
How It Works
Pivot detection scans for swing highs and lows using a configurable strength parameter. A pivot low requires the low to be lower than all surrounding bars within the strength period.

Signal Generation
The indicator generates bounce signals using TradingView's built-in pivot detection combined with candle reversal confirmation:
A cooldown period of 15 bars prevents signal spam.
Dashboard Panel
A compact dashboard displays:
Dashboard position is configurable (Top Left, Top Right, Bottom Left, Bottom Right).
Visual Elements
Input Parameters
Suggested Use Cases
Timeframe Recommendations
Works on all timeframes. Higher timeframes (4H, Daily) provide more significant levels with fewer signals. Lower timeframes show more granular structure but may produce more noise.
Limitations
Open-Source and Disclaimer
This script is published as open-source under the Mozilla Public License 2.0 for educational purposes. It does not constitute financial advice. Past performance does not guarantee future results. Always use proper risk management and conduct your own analysis before trading.
- Made with passion by officialjackofalltrades
Overview
Dimensional Support Resistance is an open-source overlay indicator that automatically detects and displays clean, non-overlapping support and resistance levels using pivot-based analysis with intelligent filtering. It identifies significant swing highs and lows, filters them by minimum distance to prevent visual clutter, and provides volume-confirmed bounce signals.
What This Indicator Does
The indicator calculates and displays:
- Dynamic Pivot Levels - Automatically detected swing highs and lows based on configurable pivot strength
- Distance Filtering - Ensures levels are spaced apart by a minimum percentage to prevent overlap
- S/R Zones - Visual zones around each level showing the price area of significance
- Bounce Detection - Identifies when price reverses at support or resistance levels
- Volume Confirmation - Strong signals require above-average volume for confirmation
How It Works
Pivot detection scans for swing highs and lows using a configurable strength parameter. A pivot low requires the low to be lower than all surrounding bars within the strength period.
Signal Generation
The indicator generates bounce signals using TradingView's built-in pivot detection combined with candle reversal confirmation:
- Support Bounce: Pivot low forms with bullish close (close > open)
- Resistance Bounce: Pivot high forms with bearish close (close < open)
- Strong Bounce: Bounce occurs with volume 1.5x above 20-period average
A cooldown period of 15 bars prevents signal spam.
Dashboard Panel
A compact dashboard displays:
- Support - Count of active support levels
- Resistance - Count of active resistance levels
Dashboard position is configurable (Top Left, Top Right, Bottom Left, Bottom Right).
Visual Elements
- Support Lines - Green horizontal lines at support levels
- Resistance Lines - Red horizontal lines at resistance levels
- S/R Zones - Semi-transparent boxes around levels showing zone width
- Price Labels - S: and R: labels showing exact price of nearest levels
- BOUNCE Markers - Triangle shapes with text when price bounces at a level
- STRONG Markers - Label shapes when bounce occurs with high volume
Input Parameters
- Lookback Period (default: 100) - Historical bars to scan for pivots
- Pivot Strength (default: 8) - Bars on each side required for valid pivot (higher = fewer but stronger levels)
- Max Levels Each Side (default: 2) - Maximum support and resistance levels displayed
- Zone Width % (default: 0.15) - Width of zones around each level as percentage of price
- Min Distance Between Levels % (default: 1.0) - Minimum spacing between levels to prevent overlap
- Show S/R Zones (default: true) - Toggle zone visualization
- Show Bounce Signals (default: true) - Toggle signal markers
- Support Color (default: #00ff88) - Color for support elements
- Resistance Color (default: #ff3366) - Color for resistance elements
Suggested Use Cases
- Identify key support and resistance levels for entry and exit planning
- Use bounce signals as potential reversal confirmation
- Combine with other indicators for confluence-based trading decisions
- Monitor strong signals for high-probability setups with volume confirmation
Timeframe Recommendations
Works on all timeframes. Higher timeframes (4H, Daily) provide more significant levels with fewer signals. Lower timeframes show more granular structure but may produce more noise.
Limitations
- Pivot detection requires lookback bars, so very recent pivots may not be immediately visible
- Bounce signals are based on pivot formation and may lag by the pivot strength period
- Levels are recalculated on each bar, so they may shift as new pivots form
Open-Source and Disclaimer
This script is published as open-source under the Mozilla Public License 2.0 for educational purposes. It does not constitute financial advice. Past performance does not guarantee future results. Always use proper risk management and conduct your own analysis before trading.
- Made with passion by officialjackofalltrades
릴리즈 노트
Dimensional Support Resistance [JOAT]
Overview
Dimensional Support Resistance is an open-source overlay indicator that automatically detects and displays clean, non-overlapping support and resistance levels using pivot-based analysis with intelligent filtering. It identifies significant swing highs and lows, filters them by minimum distance to prevent visual clutter, and provides volume-confirmed bounce signals.
What This Indicator Does
The indicator calculates and displays:
- Dynamic Pivot Levels - Automatically detected swing highs and lows based on configurable pivot strength
- Distance Filtering - Ensures levels are spaced apart by a minimum percentage to prevent overlap
- S/R Zones - Visual zones around each level showing the price area of significance
- Bounce Detection - Identifies when price reverses at support or resistance levels
- Volume Confirmation - Strong signals require above-average volume for confirmation
How It Works
Pivot detection scans for swing highs and lows using a configurable strength parameter. A pivot low requires the low to be lower than all surrounding bars within the strength period:
릴리즈 노트
Reduced default settings to be safer for all plans:Lookback: 80 → 50 (max 80)
Pivot Strength: 5 → 3 (max 6)
Stricter bounds in findPivots:
Max offset capped at 35 (was 90)
Safe strength capped at 5 (was 10)
Added extra bounds checking before accessing historical data
Fixed plotshape offset:
Changed from variable offset=-i_pivotStrength to constant offset=-3
Pine Script requires offset to be a simple int (compile-time constant)
Added display=display.pane to remove 0.00 values from status line
Fixed signal detection to use fixed pivot strength of 3 for consistent behavior
really sorry for the people who were having issues on this indicator, SOON v2 will be coming out with EVEN GREATER things!
stay tuned!
릴리즈 노트
max_bars_back=500 for better buffer allocationIncreased input limits (lookback up to 100, pivot strength up to 8, max levels up to 5)
Smarter bounds checking that uses bar_index dynamically instead of hardcoded limits
Lookback capped at 50 for performance but respects available bars
Really sorry for the people who were having errors with this indicator. It won't happen again and I will be sure of that! v2 will be even better and greater with more features and will not have any errors!! Really sorry about this, and I hope everyone uses this greatly with there strategy!
오픈 소스 스크립트
트레이딩뷰의 진정한 정신에 따라, 이 스크립트의 작성자는 이를 오픈소스로 공개하여 트레이더들이 기능을 검토하고 검증할 수 있도록 했습니다. 작성자에게 찬사를 보냅니다! 이 코드는 무료로 사용할 수 있지만, 코드를 재게시하는 경우 하우스 룰이 적용된다는 점을 기억하세요.

The Institutional Grade Trading Ecosystem, Built to win trades 📈
Get Access 👇
jackofalltrades.vip 🌐
t.me/jackofalltradesvip 🃏
Get Access 👇
jackofalltrades.vip 🌐
t.me/jackofalltradesvip 🃏
면책사항
해당 정보와 게시물은 금융, 투자, 트레이딩 또는 기타 유형의 조언이나 권장 사항으로 간주되지 않으며, 트레이딩뷰에서 제공하거나 보증하는 것이 아닙니다. 자세한 내용은 이용 약관을 참조하세요.
오픈 소스 스크립트
트레이딩뷰의 진정한 정신에 따라, 이 스크립트의 작성자는 이를 오픈소스로 공개하여 트레이더들이 기능을 검토하고 검증할 수 있도록 했습니다. 작성자에게 찬사를 보냅니다! 이 코드는 무료로 사용할 수 있지만, 코드를 재게시하는 경우 하우스 룰이 적용된다는 점을 기억하세요.
The Institutional Grade Trading Ecosystem, Built to win trades 📈
Get Access 👇
jackofalltrades.vip 🌐
t.me/jackofalltradesvip 🃏
Get Access 👇
jackofalltrades.vip 🌐
t.me/jackofalltradesvip 🃏
면책사항
해당 정보와 게시물은 금융, 투자, 트레이딩 또는 기타 유형의 조언이나 권장 사항으로 간주되지 않으며, 트레이딩뷰에서 제공하거나 보증하는 것이 아닙니다. 자세한 내용은 이용 약관을 참조하세요.