MA (50/100/200 + 250)
MA (50/100/200 + 250)
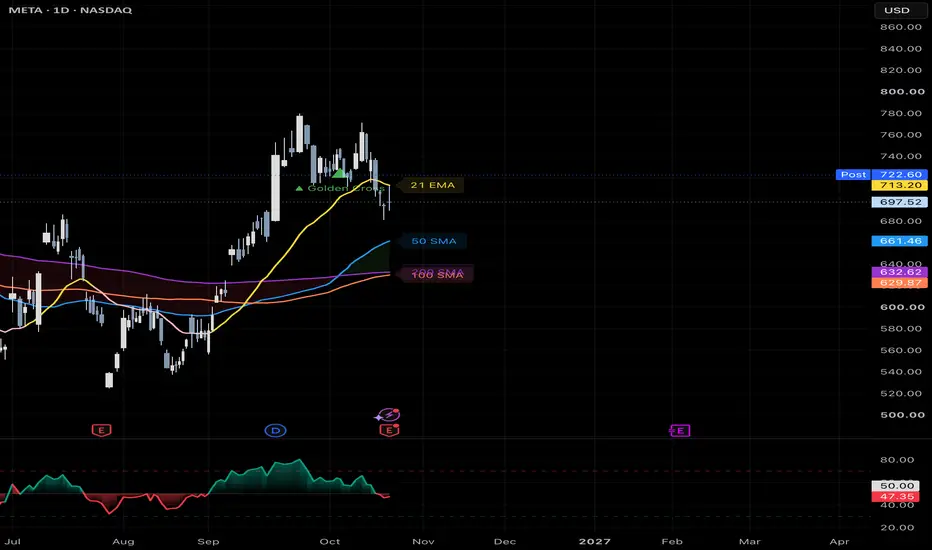
A customizable moving average overlay that brings four MA lines, trend shading, crossover markers, and clear chart labels into one indicator.
FEATURES
• Four adjustable moving averages with default lengths of 50, 100, 200, and 250 bars.
• Five calculation methods: Simple (SMA), Exponential (EMA), Weighted (WMA), Wilder’s Moving Average (RMA), and Hull (HMA).
• Independent visibility controls for each line.
• Green or red shading between the short and long moving averages.
• Golden Cross and Death Cross markers.
• Labels beside the latest bar showing each enabled MA’s actual length and calculation method.
DEFAULT SETTINGS
The indicator uses SMA calculations based on closing prices. The 50, 100, and 200 MA lines are enabled by default; the 250 MA is optional.
Default line colors:
• 50 MA: Blue
• 100 MA: Coral orange
• 200 MA: Violet
• 250 MA: Blue violet
READING THE INDICATOR
Green shading appears when the short MA is above the long MA. Red shading appears when the short MA is below the long MA.
A Golden Cross marker appears when the short MA becomes higher than the long MA after previously being equal to or below it. A Death Cross marker appears when it becomes lower after previously being equal to or above it.
These features use the short and long MA inputs, which default to 50 and 200. Changing those lengths also changes the relationship used for shading and markers. The medium and extra MAs provide additional visual context.
USAGE NOTES
Lengths represent chart bars. For example, a 50-period MA uses 50 daily bars on a daily chart or 50 hourly bars on an hourly chart. The selected MA method applies to all four lines.
Keep both the short and long MAs enabled to display trend shading and crossover markers. Disabling either also disables these features.
Values, shading, and markers can change while the current candle is forming. Wait for the candle to close when assessing a completed signal.
This indicator provides visual analysis only. It does not place trades, include built-in alert conditions, or provide backtest results. Moving averages lag price and crossover signals can occur frequently in sideways markets.
A customizable moving average overlay that brings four MA lines, trend shading, crossover markers, and clear chart labels into one indicator.
FEATURES
• Four adjustable moving averages with default lengths of 50, 100, 200, and 250 bars.
• Five calculation methods: Simple (SMA), Exponential (EMA), Weighted (WMA), Wilder’s Moving Average (RMA), and Hull (HMA).
• Independent visibility controls for each line.
• Green or red shading between the short and long moving averages.
• Golden Cross and Death Cross markers.
• Labels beside the latest bar showing each enabled MA’s actual length and calculation method.
DEFAULT SETTINGS
The indicator uses SMA calculations based on closing prices. The 50, 100, and 200 MA lines are enabled by default; the 250 MA is optional.
Default line colors:
• 50 MA: Blue
• 100 MA: Coral orange
• 200 MA: Violet
• 250 MA: Blue violet
READING THE INDICATOR
Green shading appears when the short MA is above the long MA. Red shading appears when the short MA is below the long MA.
A Golden Cross marker appears when the short MA becomes higher than the long MA after previously being equal to or below it. A Death Cross marker appears when it becomes lower after previously being equal to or above it.
These features use the short and long MA inputs, which default to 50 and 200. Changing those lengths also changes the relationship used for shading and markers. The medium and extra MAs provide additional visual context.
USAGE NOTES
Lengths represent chart bars. For example, a 50-period MA uses 50 daily bars on a daily chart or 50 hourly bars on an hourly chart. The selected MA method applies to all four lines.
Keep both the short and long MAs enabled to display trend shading and crossover markers. Disabling either also disables these features.
Values, shading, and markers can change while the current candle is forming. Wait for the candle to close when assessing a completed signal.
This indicator provides visual analysis only. It does not place trades, include built-in alert conditions, or provide backtest results. Moving averages lag price and crossover signals can occur frequently in sideways markets.

면책사항
해당 정보와 게시물은 금융, 투자, 트레이딩 또는 기타 유형의 조언이나 권장 사항으로 간주되지 않으며, 트레이딩뷰에서 제공하거나 보증하는 것이 아닙니다. 자세한 내용은 이용 약관을 참조하세요.
면책사항
해당 정보와 게시물은 금융, 투자, 트레이딩 또는 기타 유형의 조언이나 권장 사항으로 간주되지 않으며, 트레이딩뷰에서 제공하거나 보증하는 것이 아닙니다. 자세한 내용은 이용 약관을 참조하세요.