F&O Charges & Breakeven Meter
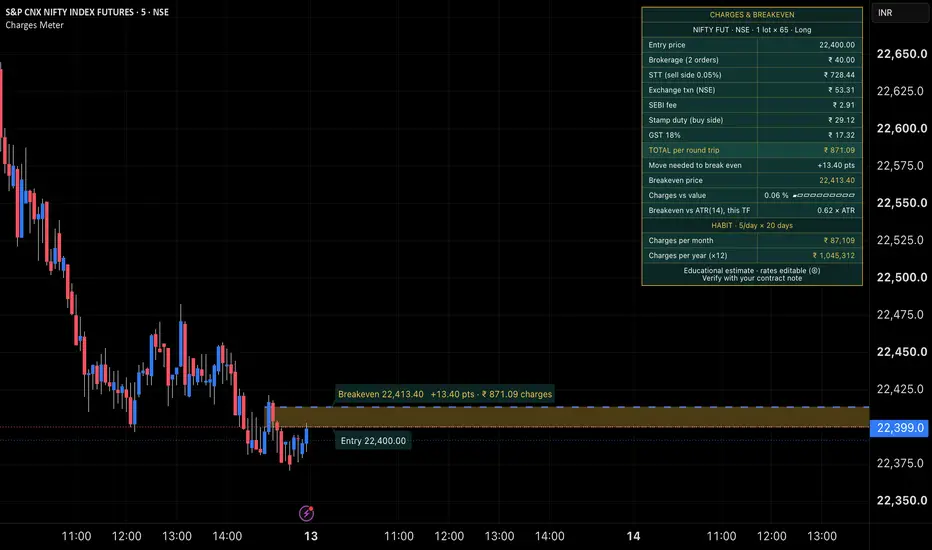
F&O Charges & Breakeven Meter shows the full cost of an Indian index futures or options trade before it can make a single rupee. It adds up every broker and statutory charge for a complete round trip (one buy order plus one sell order), solves for the exact price the contract must reach just to break even, and projects what those charges add up to over a month and a year at the trading frequency you choose.
Most traders know their brokerage. Far fewer add STT, the exchange transaction charge, the SEBI fee, stamp duty and GST, or notice how quickly they compound when several trades are placed every day. This script puts that cost on the chart, next to price, so it can be seen before a trade is taken.
WHAT YOU SEE
On the chart (Auto mode):
- A dotted line at your entry price.
- A dashed breakeven line at the price where gross profit exactly pays all round-trip charges.
- A shaded cost zone between the two lines: the distance price has to travel before the trade stops losing to costs.
- Two labels, pinned to the right edge of the visible chart, showing the entry price and the breakeven price with the points needed and the rupee charges. They stay on screen when you scroll or drag the chart.
In the table:
- Every charge on its own line: brokerage, STT, exchange transaction charge, SEBI fee, stamp duty, GST.
- Total charges per round trip.
- Move needed to break even (in points) and the breakeven price.
- Charges as a percentage of the premium (options) or contract value (futures), with a 10-step bar.
- The breakeven move as a multiple of ATR(14) on the current timeframe, to compare the cost with how much this contract typically moves per bar.
- Habit projection: total charges per month and per year at your trades-per-day and days-per-month settings.
HOW TO USE IT — AUTO MODE (one trade on the chart's contract)
1. Open the chart of the contract you want to cost, for example a NIFTY weekly option, a SENSEX option or NIFTY futures.
2. Add the indicator. TradingView asks you to click on the chart: click at your entry price. The table and the lines appear immediately.
3. The script reads the chart symbol and fills in the rest by itself:
• option or futures, and for options the strike and CE/PE
• the exchange (NSE or BSE)
• the underlying, and its lot size from the built-in presets
The second row of the table confirms what it detected, for example "NIFTY 22350 CE · NSE · 1 lot × 65 · Long".
4. In Settings → ② Trade, set Direction (Buy first = long, Sell first = short) and the number of Lots. For a short trade the breakeven line moves below the entry.
5. Read the table and the breakeven line before placing the trade.
Changing the entry price later — three ways:
- Click again: hover over the indicator name at the top left of the chart, open the More menu (⋯) and choose "Reset points". TradingView asks for a new click; click your new entry price. The indicator does not need to be removed.
- Drag: click the indicator once to select it, then drag the entry handle up or down. Everything updates as you move it.
- Type: Settings → ② Trade → type the price in the Entry price field.
Prefer it to follow the market? Set Entry price to "Last price" and the meter always costs a trade at the latest price.
If the table says "Open an index option or futures chart", the symbol could not be recognised (for example you are on the index chart itself). Set Instrument to "Option (CE/PE)" or "Futures" in ② Trade and type your entry price.
HOW TO USE IT — MY STRATEGY MODE (multi-leg positions)
Use this for straddles, strangles, iron flies, spreads or hedged futures.
1. Settings → ① Mode → choose "My Strategy (legs below)".
2. Settings → ④ My Strategy: up to four legs. For each leg:
• tick the box to switch the leg on
• choose Buy or Sell
• choose CE, PE or FUT
• type the entry price (premium for options, price for futures)
• set the number of lots
The default is a short straddle (Sell CE + Sell PE). Legs 3 and 4 are off; switch them on to add wings for an iron fly or an iron condor.
3. All legs use the lot size and exchange from ③ Contract (detected from the chart, or set by you). Open any chart of the same underlying, or set the lot size to Custom.
4. The table shows, per leg: side, type, price, lots and the round-trip charges for that leg. Below it:
• Total charges for the whole position, in and out
• Net premium received (credit) or paid (debit), options legs only
• Charges as a percentage of that net premium, with a bar
• Credit left after charges (or debit including charges)
• Monthly and yearly projection, where "cycles per day" means how many times a day you open and close the whole position
5. Chart lines are drawn in Auto mode only; My Strategy mode is a table.
HOW IT CALCULATES
For a round trip of quantity Q = lots × lot size, with buy value B and sell value S:
- Brokerage: a flat fee per executed order for options; for futures, the lower of the flat fee and a percentage of order value.
- STT: a percentage of the sell-side value (premium for options, contract value for futures).
- Exchange transaction charge: a percentage of total turnover (B + S), with separate NSE and BSE rates for options and futures.
- SEBI fee: rupees per crore of turnover.
- Stamp duty: a percentage of the buy-side value.
- GST: a percentage of (brokerage + exchange transaction charge + SEBI fee).
The breakeven price is solved, not approximated: the script recomputes all charges at the candidate exit price and repeats until gross profit equals total charges. In My Strategy mode each leg is costed as a round trip at its own entry price.
DEFAULT RATES AND HOW TO CHANGE THEM
Defaults are the published statutory and exchange rates as checked in October 2026, including the STT revision effective 1 April 2026:
- STT: options 0.15% of premium, futures 0.05% of value, sell side
- Exchange transaction charge: NSE options 0.03553%, NSE futures 0.00183%, BSE options 0.0325%, BSE futures 0
- SEBI fee: ₹10 per crore of turnover
- Stamp duty: options 0.003%, futures 0.002%, buy side
- GST: 18%
- Brokerage: ₹20 per executed order (futures: 0.03% capped at ₹20)
Every one of these is an editable input in ⑥ Charges, so the script stays usable when rates change or if your broker's plan is different (for example a zero-brokerage plan: set brokerage to 0).
Lot-size presets (exchange revisions as of October 2026): NIFTY 65, BANKNIFTY 30, FINNIFTY 60, MIDCPNIFTY 120, NIFTYNXT50 25, SENSEX 20. Exchanges revise lot sizes from time to time; choose Custom in ③ Contract if yours differs. Underlyings without a preset show a reminder to set the lot size.
SETTINGS AT A GLANCE
① Mode: Auto (this chart) or My Strategy
② Trade: instrument override, direction, entry price (clicked/typed or last price), lots
③ Contract: lot size (preset or custom), exchange (auto, NSE, BSE)
④ My Strategy legs: up to four legs
⑤ Habit projection: trades or strategy cycles per day, trading days per month
⑥ Charges: every rate, editable
⑦ Chart visuals: show/hide lines and cost zone, how far back the lines start, breakeven line style and width, colours of the entry line, breakeven line and cost zone, label position (right edge of the chart or start of the lines), label size, label background and label text colours
⑧ Table: position, text size and every table colour
All inputs are hidden from the status line to keep the chart clean.
PRACTICAL USES
- Before a trade: see how far price must move just to cover costs. If the breakeven move is a large fraction of the typical bar range (the ATR row), the trade needs a sizeable move before it can show a net profit.
- Option sellers: see what share of the premium collected is consumed by charges.
- Frequent traders: enter your real number of trades per day and look at the monthly and yearly totals.
- Comparing scenarios: change lots, premium or brokerage and watch the breakeven and percentages update.
LIMITATIONS
- This is an estimate for planning and education, not a contract note. Brokers differ: zero-brokerage plans, per-order caps, platform or DP charges and other fees are not included. Always check against your broker's contract note.
- IPFT (about ₹0.01 per crore on NSE) is ignored as negligible.
- The script models a normal square-off. Options held to expiry and exercised are charged STT on intrinsic value and may attract additional broker fees; exercise and assignment are not modelled.
- In My Strategy mode all legs share one lot size and exchange, and each leg is costed at its entry price.
- Auto-detection relies on TradingView's ticker format for Indian index options and futures; if it does not recognise a contract, set the Instrument manually.
- The labels follow the visible right edge of the chart, so the script recalculates briefly when the chart is scrolled. This is expected.
- The script shows no buy or sell signals and makes no forecast about price. It only calculates costs.
This script is for educational purposes only and is not investment advice. Futures and options trading carries a high level of risk.
Most traders know their brokerage. Far fewer add STT, the exchange transaction charge, the SEBI fee, stamp duty and GST, or notice how quickly they compound when several trades are placed every day. This script puts that cost on the chart, next to price, so it can be seen before a trade is taken.
WHAT YOU SEE
On the chart (Auto mode):
- A dotted line at your entry price.
- A dashed breakeven line at the price where gross profit exactly pays all round-trip charges.
- A shaded cost zone between the two lines: the distance price has to travel before the trade stops losing to costs.
- Two labels, pinned to the right edge of the visible chart, showing the entry price and the breakeven price with the points needed and the rupee charges. They stay on screen when you scroll or drag the chart.
In the table:
- Every charge on its own line: brokerage, STT, exchange transaction charge, SEBI fee, stamp duty, GST.
- Total charges per round trip.
- Move needed to break even (in points) and the breakeven price.
- Charges as a percentage of the premium (options) or contract value (futures), with a 10-step bar.
- The breakeven move as a multiple of ATR(14) on the current timeframe, to compare the cost with how much this contract typically moves per bar.
- Habit projection: total charges per month and per year at your trades-per-day and days-per-month settings.
HOW TO USE IT — AUTO MODE (one trade on the chart's contract)
1. Open the chart of the contract you want to cost, for example a NIFTY weekly option, a SENSEX option or NIFTY futures.
2. Add the indicator. TradingView asks you to click on the chart: click at your entry price. The table and the lines appear immediately.
3. The script reads the chart symbol and fills in the rest by itself:
• option or futures, and for options the strike and CE/PE
• the exchange (NSE or BSE)
• the underlying, and its lot size from the built-in presets
The second row of the table confirms what it detected, for example "NIFTY 22350 CE · NSE · 1 lot × 65 · Long".
4. In Settings → ② Trade, set Direction (Buy first = long, Sell first = short) and the number of Lots. For a short trade the breakeven line moves below the entry.
5. Read the table and the breakeven line before placing the trade.
Changing the entry price later — three ways:
- Click again: hover over the indicator name at the top left of the chart, open the More menu (⋯) and choose "Reset points". TradingView asks for a new click; click your new entry price. The indicator does not need to be removed.
- Drag: click the indicator once to select it, then drag the entry handle up or down. Everything updates as you move it.
- Type: Settings → ② Trade → type the price in the Entry price field.
Prefer it to follow the market? Set Entry price to "Last price" and the meter always costs a trade at the latest price.
If the table says "Open an index option or futures chart", the symbol could not be recognised (for example you are on the index chart itself). Set Instrument to "Option (CE/PE)" or "Futures" in ② Trade and type your entry price.
HOW TO USE IT — MY STRATEGY MODE (multi-leg positions)
Use this for straddles, strangles, iron flies, spreads or hedged futures.
1. Settings → ① Mode → choose "My Strategy (legs below)".
2. Settings → ④ My Strategy: up to four legs. For each leg:
• tick the box to switch the leg on
• choose Buy or Sell
• choose CE, PE or FUT
• type the entry price (premium for options, price for futures)
• set the number of lots
The default is a short straddle (Sell CE + Sell PE). Legs 3 and 4 are off; switch them on to add wings for an iron fly or an iron condor.
3. All legs use the lot size and exchange from ③ Contract (detected from the chart, or set by you). Open any chart of the same underlying, or set the lot size to Custom.
4. The table shows, per leg: side, type, price, lots and the round-trip charges for that leg. Below it:
• Total charges for the whole position, in and out
• Net premium received (credit) or paid (debit), options legs only
• Charges as a percentage of that net premium, with a bar
• Credit left after charges (or debit including charges)
• Monthly and yearly projection, where "cycles per day" means how many times a day you open and close the whole position
5. Chart lines are drawn in Auto mode only; My Strategy mode is a table.
HOW IT CALCULATES
For a round trip of quantity Q = lots × lot size, with buy value B and sell value S:
- Brokerage: a flat fee per executed order for options; for futures, the lower of the flat fee and a percentage of order value.
- STT: a percentage of the sell-side value (premium for options, contract value for futures).
- Exchange transaction charge: a percentage of total turnover (B + S), with separate NSE and BSE rates for options and futures.
- SEBI fee: rupees per crore of turnover.
- Stamp duty: a percentage of the buy-side value.
- GST: a percentage of (brokerage + exchange transaction charge + SEBI fee).
The breakeven price is solved, not approximated: the script recomputes all charges at the candidate exit price and repeats until gross profit equals total charges. In My Strategy mode each leg is costed as a round trip at its own entry price.
DEFAULT RATES AND HOW TO CHANGE THEM
Defaults are the published statutory and exchange rates as checked in October 2026, including the STT revision effective 1 April 2026:
- STT: options 0.15% of premium, futures 0.05% of value, sell side
- Exchange transaction charge: NSE options 0.03553%, NSE futures 0.00183%, BSE options 0.0325%, BSE futures 0
- SEBI fee: ₹10 per crore of turnover
- Stamp duty: options 0.003%, futures 0.002%, buy side
- GST: 18%
- Brokerage: ₹20 per executed order (futures: 0.03% capped at ₹20)
Every one of these is an editable input in ⑥ Charges, so the script stays usable when rates change or if your broker's plan is different (for example a zero-brokerage plan: set brokerage to 0).
Lot-size presets (exchange revisions as of October 2026): NIFTY 65, BANKNIFTY 30, FINNIFTY 60, MIDCPNIFTY 120, NIFTYNXT50 25, SENSEX 20. Exchanges revise lot sizes from time to time; choose Custom in ③ Contract if yours differs. Underlyings without a preset show a reminder to set the lot size.
SETTINGS AT A GLANCE
① Mode: Auto (this chart) or My Strategy
② Trade: instrument override, direction, entry price (clicked/typed or last price), lots
③ Contract: lot size (preset or custom), exchange (auto, NSE, BSE)
④ My Strategy legs: up to four legs
⑤ Habit projection: trades or strategy cycles per day, trading days per month
⑥ Charges: every rate, editable
⑦ Chart visuals: show/hide lines and cost zone, how far back the lines start, breakeven line style and width, colours of the entry line, breakeven line and cost zone, label position (right edge of the chart or start of the lines), label size, label background and label text colours
⑧ Table: position, text size and every table colour
All inputs are hidden from the status line to keep the chart clean.
PRACTICAL USES
- Before a trade: see how far price must move just to cover costs. If the breakeven move is a large fraction of the typical bar range (the ATR row), the trade needs a sizeable move before it can show a net profit.
- Option sellers: see what share of the premium collected is consumed by charges.
- Frequent traders: enter your real number of trades per day and look at the monthly and yearly totals.
- Comparing scenarios: change lots, premium or brokerage and watch the breakeven and percentages update.
LIMITATIONS
- This is an estimate for planning and education, not a contract note. Brokers differ: zero-brokerage plans, per-order caps, platform or DP charges and other fees are not included. Always check against your broker's contract note.
- IPFT (about ₹0.01 per crore on NSE) is ignored as negligible.
- The script models a normal square-off. Options held to expiry and exercised are charged STT on intrinsic value and may attract additional broker fees; exercise and assignment are not modelled.
- In My Strategy mode all legs share one lot size and exchange, and each leg is costed at its entry price.
- Auto-detection relies on TradingView's ticker format for Indian index options and futures; if it does not recognise a contract, set the Instrument manually.
- The labels follow the visible right edge of the chart, so the script recalculates briefly when the chart is scrolled. This is expected.
- The script shows no buy or sell signals and makes no forecast about price. It only calculates costs.
This script is for educational purposes only and is not investment advice. Futures and options trading carries a high level of risk.

면책사항
해당 정보와 게시물은 금융, 투자, 트레이딩 또는 기타 유형의 조언이나 권장 사항으로 간주되지 않으며, 트레이딩뷰에서 제공하거나 보증하는 것이 아닙니다. 자세한 내용은 이용 약관을 참조하세요.
면책사항
해당 정보와 게시물은 금융, 투자, 트레이딩 또는 기타 유형의 조언이나 권장 사항으로 간주되지 않으며, 트레이딩뷰에서 제공하거나 보증하는 것이 아닙니다. 자세한 내용은 이용 약관을 참조하세요.