OPEN-SOURCE SCRIPT
Claudia Rea inspired Price Grid
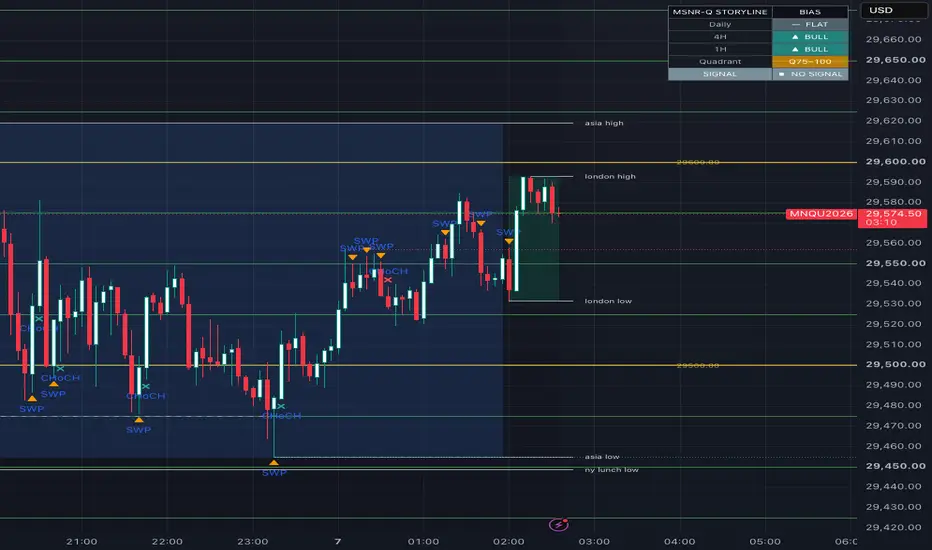
Inspired by Claudia Rea
Price Grid (Fixed Interval)
A configurable horizontal price grid that anchors to the current price and extends a fixed number of evenly-spaced levels above and below it — rather than to a fixed historical high/low, so the grid stays consistent regardless of timeframe or how much chart history has loaded.
How it works
Finds the nearest grid level below the current close, then draws lines at fixed Grid Spacing intervals above and below that anchor
Every Nth line (set by Major Line Every N Lines) is rendered thicker and in a different color, with a price label — useful for marking round numbers or larger intervals (e.g. $25 minor / $100 major) inside the same grid
Redraws only on the most recent bar, so it stays lightweight even on lower timeframes
Inputs
Grid Spacing — distance between minor lines
Major Line Every N Lines — how many minor steps between each major (labeled) line
Lines Above/Below Price — how many lines to draw on each side of price
Bars of History to Span Left — cosmetic only, controls how far left the lines are drawn
Show Price Labels / Extend Lines Right / line colors — display options
Notes
This is a purely mechanical price grid — it does not predict direction or generate signals. Round-number and fixed-interval levels can act as areas of interest on some instruments, but reactions at any given line are not guaranteed and should be combined with your own market structure analysis.
Works on any symbol or timeframe; grid spacing should be adjusted to match the instrument's typical volatility (e.g. smaller spacing for lower-priced or less volatile instruments).
오픈 소스 스크립트
트레이딩뷰의 진정한 정신에 따라, 이 스크립트의 작성자는 이를 오픈소스로 공개하여 트레이더들이 기능을 검토하고 검증할 수 있도록 했습니다. 작성자에게 찬사를 보냅니다! 이 코드는 무료로 사용할 수 있지만, 코드를 재게시하는 경우 하우스 룰이 적용된다는 점을 기억하세요.

면책사항
해당 정보와 게시물은 금융, 투자, 트레이딩 또는 기타 유형의 조언이나 권장 사항으로 간주되지 않으며, 트레이딩뷰에서 제공하거나 보증하는 것이 아닙니다. 자세한 내용은 이용 약관을 참조하세요.
오픈 소스 스크립트
트레이딩뷰의 진정한 정신에 따라, 이 스크립트의 작성자는 이를 오픈소스로 공개하여 트레이더들이 기능을 검토하고 검증할 수 있도록 했습니다. 작성자에게 찬사를 보냅니다! 이 코드는 무료로 사용할 수 있지만, 코드를 재게시하는 경우 하우스 룰이 적용된다는 점을 기억하세요.
면책사항
해당 정보와 게시물은 금융, 투자, 트레이딩 또는 기타 유형의 조언이나 권장 사항으로 간주되지 않으며, 트레이딩뷰에서 제공하거나 보증하는 것이 아닙니다. 자세한 내용은 이용 약관을 참조하세요.