[SkuldX] Trading Sessions
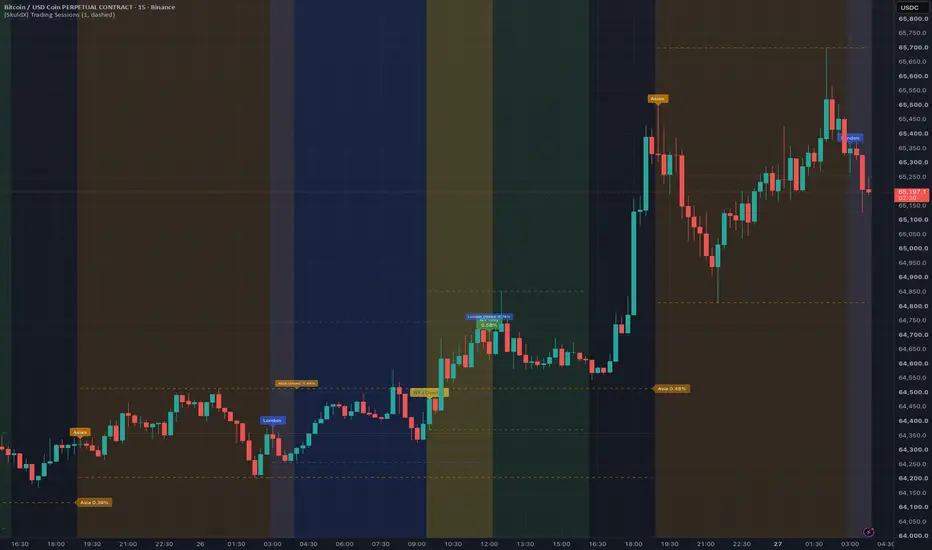
SkuldX Trading Sessions — Professional Session Structure Visualizer
by SkuldX Trading Systems
What is it?
SkuldX Trading Sessions maps the full 24-hour trading day into its distinct institutional phases and displays each session's High, Low, and Midpoint directly on the chart. Every session has independent controls — color, labels, levels, and visibility — so you see exactly what you need without clutter. Two optional sessions cover the low-liquidity transition zones that most traders ignore but institutions actively use to position before major opens.
Sessions covered
The indicator tracks six distinct market phases using New York timezone with automatic DST adjustment:
⬛ Overnight — 16:00–19:00 NY (off by default). The quiet window between NY close and Asian open. Extremely low liquidity. Useful for identifying where price settles after the US session before Asia takes over. Gaps between the NY close and Asian open often get filled during London or NY.
🟠 Asian Session — 19:00–04:00 NY. The accumulation and liquidity-building phase. Asian High and Low define the range boundaries that London and New York will interact with throughout the day. The size of the Asian range is a leading indicator of the day's volatility — a tight Asian range often precedes a large directional move in London or NY.
🩵 Pre-London — 04:00–09:00 NY (off by default). The transition window between Asian close and London open. Price often uses this period to retest Asian levels or build a new directional bias before the first major institutional session. Useful for traders who want visibility into what happens between sessions.
🔵 London Session — 03:00–12:00 NY. The first major institutional session. London frequently initiates the directional move of the day — breaking Asian range boundaries, sweeping liquidity, and establishing bias. The London High and Low often become the key reference levels for NY entries.
🟢 New York Session — 09:30–16:00 NY. The highest-liquidity session. NY either continues the London move or reverses it. The most significant OI events and volume spikes occur during this window.
🟡 London + NY Overlap — 09:30–12:00 NY. The single most volatile window of the trading day. Both institutional pools are simultaneously active. The largest moves, cleanest breakouts, and highest-conviction signals consistently appear during this period.
Asian levels extended to NY close
When Extend Asian Levels to NY Close is enabled, the Asian High, Low, and Midpoint lines remain visible across London, Overlap, and NY — stretching all the way to 16:00 NY. A label showing the Asian range size in percentage stays at the right edge of the lines throughout the day.
This is one of the most useful features for intraday traders. The Asian range acts as a reference structure for the entire day — London often targets one extreme while NY targets the other. Keeping these levels visible at all times eliminates the need to draw them manually or switch to a daily timeframe.
Session size %
Every session displays its range as a percentage of price. This appears in two places — as a small label at the session close and in the Data Window when hovering over any bar.
Session size % is immediately useful for several reasons. Comparing today's Asian size to recent averages tells you whether the day is likely to be trending or ranging. A London range that is much larger than the Asian range signals strong directional conviction. A NY range smaller than London suggests exhaustion or consolidation.
H/L/Mid levels
Each session draws its High, Low, and optional Midpoint as horizontal lines for the duration of that session. These become permanent historical reference levels once the session closes — visible on the chart for backtesting and pattern recognition across multiple days.
The Midpoint is particularly valuable. Price consistently gravitates toward session midpoints during retracement phases, and a session that closes near its midpoint signals indecision rather than conviction.
Settings reference
Each session has its own independent group of settings:
Show [Session] — master visibility toggle
Color — fully customizable background and level color
Show Label — toggles the session name label at open
Show H/L/Mid Levels — toggles the horizontal level lines
Extend Asian Levels to NY Close — keeps Asian H/L/Mid visible all day (Asian only)
Show Session Size % — includes the range percentage in session close labels
Level Line Width / Style — global line appearance for all session levels
Show Midpoint — global toggle for all session midpoint lines
Data Window
Hovering over any bar shows the current High, Low, Mid, and Size % for all sessions simultaneously. This is useful for quickly checking where the Asian range sits relative to current price, or comparing session sizes without reading the chart visually.
How to use it in practice
Building daily bias — check the Asian range size at 04:00 NY when it closes. A range above your recent average suggests an active overnight session with strong positioning. A tight range suggests consolidation and a potentially large London move ahead.
Identifying key levels — Asian High and Low with extension enabled are your primary reference levels for the full day. London frequently sweeps one of these before reversing. NY often targets the opposite extreme. These two levels alone define the day's structural framework.
Reading London intent — when London opens, watch whether it immediately respects Asian levels or drives through them. A clean break with a strong London candle signals directional conviction. A false break that returns inside Asian range signals a potential reversal setup.
Overlap as the signal window — the yellow Overlap zone is where the day's move typically reaches its conclusion or inflection. If price has been trending since London open and reaches a significant level during Overlap, the probability of at least a partial reversal or consolidation increases significantly.
Pre-London context — enable Pre-London to see where price travels in the quiet window before London opens. A Pre-London session that makes a new high above Asian High and then returns inside the range before London opens is a classic setup signal — the stop hunt has already occurred and London may drive aggressively in the opposite direction.
Session size comparison — when London Size % is significantly larger than Asian Size %, the day has strong institutional momentum. When NY Size % exceeds London Size %, NY is driving the day rather than following it — often signals a reversal of the London direction.
Built for SkuldX ecosystem
SkuldX Trading Sessions is the structural foundation of the SkuldX suite. Session High/Low/Mid levels feed directly into the London Analysis scoring system.
by SkuldX Trading Systems
What is it?
SkuldX Trading Sessions maps the full 24-hour trading day into its distinct institutional phases and displays each session's High, Low, and Midpoint directly on the chart. Every session has independent controls — color, labels, levels, and visibility — so you see exactly what you need without clutter. Two optional sessions cover the low-liquidity transition zones that most traders ignore but institutions actively use to position before major opens.
Sessions covered
The indicator tracks six distinct market phases using New York timezone with automatic DST adjustment:
⬛ Overnight — 16:00–19:00 NY (off by default). The quiet window between NY close and Asian open. Extremely low liquidity. Useful for identifying where price settles after the US session before Asia takes over. Gaps between the NY close and Asian open often get filled during London or NY.
🟠 Asian Session — 19:00–04:00 NY. The accumulation and liquidity-building phase. Asian High and Low define the range boundaries that London and New York will interact with throughout the day. The size of the Asian range is a leading indicator of the day's volatility — a tight Asian range often precedes a large directional move in London or NY.
🩵 Pre-London — 04:00–09:00 NY (off by default). The transition window between Asian close and London open. Price often uses this period to retest Asian levels or build a new directional bias before the first major institutional session. Useful for traders who want visibility into what happens between sessions.
🔵 London Session — 03:00–12:00 NY. The first major institutional session. London frequently initiates the directional move of the day — breaking Asian range boundaries, sweeping liquidity, and establishing bias. The London High and Low often become the key reference levels for NY entries.
🟢 New York Session — 09:30–16:00 NY. The highest-liquidity session. NY either continues the London move or reverses it. The most significant OI events and volume spikes occur during this window.
🟡 London + NY Overlap — 09:30–12:00 NY. The single most volatile window of the trading day. Both institutional pools are simultaneously active. The largest moves, cleanest breakouts, and highest-conviction signals consistently appear during this period.
Asian levels extended to NY close
When Extend Asian Levels to NY Close is enabled, the Asian High, Low, and Midpoint lines remain visible across London, Overlap, and NY — stretching all the way to 16:00 NY. A label showing the Asian range size in percentage stays at the right edge of the lines throughout the day.
This is one of the most useful features for intraday traders. The Asian range acts as a reference structure for the entire day — London often targets one extreme while NY targets the other. Keeping these levels visible at all times eliminates the need to draw them manually or switch to a daily timeframe.
Session size %
Every session displays its range as a percentage of price. This appears in two places — as a small label at the session close and in the Data Window when hovering over any bar.
Session size % is immediately useful for several reasons. Comparing today's Asian size to recent averages tells you whether the day is likely to be trending or ranging. A London range that is much larger than the Asian range signals strong directional conviction. A NY range smaller than London suggests exhaustion or consolidation.
H/L/Mid levels
Each session draws its High, Low, and optional Midpoint as horizontal lines for the duration of that session. These become permanent historical reference levels once the session closes — visible on the chart for backtesting and pattern recognition across multiple days.
The Midpoint is particularly valuable. Price consistently gravitates toward session midpoints during retracement phases, and a session that closes near its midpoint signals indecision rather than conviction.
Settings reference
Each session has its own independent group of settings:
Show [Session] — master visibility toggle
Color — fully customizable background and level color
Show Label — toggles the session name label at open
Show H/L/Mid Levels — toggles the horizontal level lines
Extend Asian Levels to NY Close — keeps Asian H/L/Mid visible all day (Asian only)
Show Session Size % — includes the range percentage in session close labels
Level Line Width / Style — global line appearance for all session levels
Show Midpoint — global toggle for all session midpoint lines
Data Window
Hovering over any bar shows the current High, Low, Mid, and Size % for all sessions simultaneously. This is useful for quickly checking where the Asian range sits relative to current price, or comparing session sizes without reading the chart visually.
How to use it in practice
Building daily bias — check the Asian range size at 04:00 NY when it closes. A range above your recent average suggests an active overnight session with strong positioning. A tight range suggests consolidation and a potentially large London move ahead.
Identifying key levels — Asian High and Low with extension enabled are your primary reference levels for the full day. London frequently sweeps one of these before reversing. NY often targets the opposite extreme. These two levels alone define the day's structural framework.
Reading London intent — when London opens, watch whether it immediately respects Asian levels or drives through them. A clean break with a strong London candle signals directional conviction. A false break that returns inside Asian range signals a potential reversal setup.
Overlap as the signal window — the yellow Overlap zone is where the day's move typically reaches its conclusion or inflection. If price has been trending since London open and reaches a significant level during Overlap, the probability of at least a partial reversal or consolidation increases significantly.
Pre-London context — enable Pre-London to see where price travels in the quiet window before London opens. A Pre-London session that makes a new high above Asian High and then returns inside the range before London opens is a classic setup signal — the stop hunt has already occurred and London may drive aggressively in the opposite direction.
Session size comparison — when London Size % is significantly larger than Asian Size %, the day has strong institutional momentum. When NY Size % exceeds London Size %, NY is driving the day rather than following it — often signals a reversal of the London direction.
Built for SkuldX ecosystem
SkuldX Trading Sessions is the structural foundation of the SkuldX suite. Session High/Low/Mid levels feed directly into the London Analysis scoring system.

Visit skuldxtrade.com to learn more about SkuldX Trading Systems.
면책사항
해당 정보와 게시물은 금융, 투자, 트레이딩 또는 기타 유형의 조언이나 권장 사항으로 간주되지 않으며, 트레이딩뷰에서 제공하거나 보증하는 것이 아닙니다. 자세한 내용은 이용 약관을 참조하세요.
Visit skuldxtrade.com to learn more about SkuldX Trading Systems.
면책사항
해당 정보와 게시물은 금융, 투자, 트레이딩 또는 기타 유형의 조언이나 권장 사항으로 간주되지 않으며, 트레이딩뷰에서 제공하거나 보증하는 것이 아닙니다. 자세한 내용은 이용 약관을 참조하세요.