OPEN-SOURCE SCRIPT
Crypto Spaghetti 40 Pro
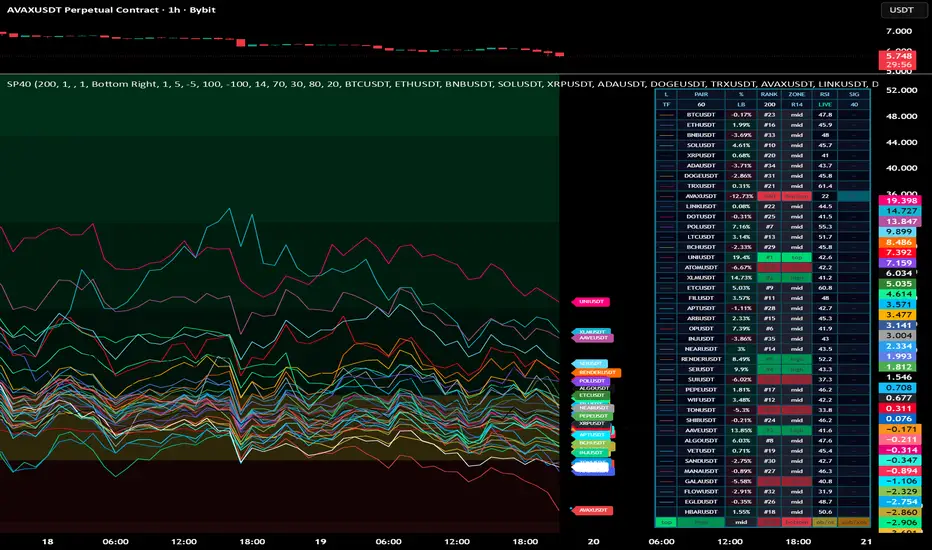
crypto spaghetti 40 pro future is a multi-symbol relative strength dashboard designed to compare up to 40 crypto pairs in one clean oscillator panel.
the tool does not display normal price. instead, it rebases every selected token from the same lookback point and shows its relative performance as a percentage. this makes it easier to see which tokens are leading, which tokens are lagging, and where rotation is happening inside a crypto basket.
main idea
most traders look at one chart at a time. this tool helps compare many markets at once.
each line represents one token.
when a line is above zero, that token is performing better than its starting point over the selected lookback.
when a line is below zero, that token is performing weaker than its starting point over the selected lookback.
when one line rises faster than the others, that token is showing relative strength.
when one line falls faster than the others, that token is showing relative weakness.
what the indicator shows
performance lines
the script plots up to 40 crypto pairs as percentage performance lines. all pairs are rebased using the same lookback value, so they can be compared on the same scale.
zero line
the zero line is the base level. values above zero show positive performance from the rebase point. values below zero show negative performance from the rebase point.
background zones
the green area shows stronger positive performance.
the yellow area shows the neutral zone.
the red area shows weaker negative performance.
these zones are visual guides only. they help separate strong, neutral, and weak conditions.
rsi dots
small dots can appear on the lines when the selected token reaches rsi overbought, extreme overbought, oversold, or extreme oversold conditions.
these dots are not automatic buy or sell signals. they are momentum warnings.
panel
the panel shows each token with several useful readings:
pair: the selected crypto pair.
percent: the current relative performance.
rank: the current position of the token inside the 40-symbol basket.
zone: top, high, mid, low, or bottom.
rsi: the current rsi value.
sig: rsi status such as ob, xob, os, or xos.
rank and zone
rank shows where a token stands compared to the rest of the basket.
rank #1 means the strongest token in the current basket.
rank #40 means the weakest token in the current basket.
top means the current leader.
high means the token is inside the top group.
mid means the token is in the middle of the basket.
low means the token is inside the weak group.
bottom means the current weakest token.
this ranking system makes it easier to identify leaders and laggards without relying only on line colors.
alerts
the script includes dynamic alert logic using alert calls.
available alert logic includes:
new top token
new bottom token
token enters top 5
token enters bottom 5
top 5 token with rsi overbought or extreme overbought
bottom 5 token with rsi oversold or extreme oversold
performance crosses above the neutral top zone
performance crosses below the neutral bottom zone
to use these alerts, create a tradingview alert and select the condition:
any alert() function call
how to use the tool
step 1: choose the symbols
select the crypto pairs you want to compare. the default list includes major crypto assets and popular altcoins. you can replace any symbol with another pair.
step 2: choose the lookback
the rebase lookback controls how far back the comparison starts.
a shorter lookback gives a more reactive view.
a longer lookback gives a broader market rotation view.
for beginners, a lookback around 200 bars gives a balanced view.
step 3: read the zero line
tokens above zero are outperforming their own starting point.
tokens below zero are underperforming their own starting point.
tokens near zero are close to neutral.
step 4: check rank
rank is one of the most important readings.
a token ranked #1 is the current strongest performer in the selected basket.
a token ranked in the top 5 is part of the strongest group.
a token ranked in the bottom 5 is part of the weakest group.
step 5: check rsi status
if a token is top ranked and also shows ob or xob, it is strong but may be stretched.
if a token is bottom ranked and also shows os or xos, it is weak but may be stretched to the downside.
rsi does not replace price action. it only adds momentum context.
beginner examples
example 1: finding the strongest token
if sol is ranked #1 and its performance line is rising above the others, sol is currently leading the selected basket.
a beginner can use this information to focus analysis on sol instead of searching across many charts manually.
this does not mean immediate entry. the trader should still check structure, trend, support, resistance, and risk.
example 2: identifying weakness
if a token is ranked #40 and its line is deep in the red zone, it is the weakest token in the selected group.
this can help traders avoid weak assets during bullish conditions or watch for possible continuation weakness.
example 3: rotation
if btc was rank #1 and then eth becomes rank #1, the alert can show a top rotation.
this means leadership inside the basket has changed.
rotation can help traders understand where market attention is moving.
example 4: top 5 with rsi overbought
if a token enters the top 5 and rsi is overbought, the token is strong but potentially extended.
a beginner should not chase blindly. it is usually better to wait for a pullback, a clean continuation setup, or confirmation on the price chart.
example 5: bottom 5 with rsi oversold
if a token enters the bottom 5 and rsi is oversold, the token is weak and may be stretched.
this can be useful for studying possible capitulation, but it is not a buy signal by itself.
best use cases
market rotation analysis
crypto basket comparison
finding relative strength
finding relative weakness
spotting leaders and laggards
monitoring top 5 and bottom 5 changes
watching rsi extremes across many symbols
building a watchlist for further analysis
suggested beginner workflow
first, check the top 5.
then, check if those tokens are above zero.
then, check if they are still rising or already flat.
after that, open the normal price chart of the strongest token.
look for structure, trend, support, resistance, volume, and risk level.
do the same with the bottom 5 if you want to study weak markets.
do not trade only because a token is top ranked or bottom ranked.
the indicator is a scanner and comparison tool. it is not a full trading system.
settings explained
rebase lookback bars
sets how many bars are used as the starting point for the performance comparison.
smoothing
smooths the performance lines. higher values make the lines cleaner but slower.
use log-return style
uses log-style performance calculation instead of simple percentage calculation.
request timeframe
allows the comparison to be calculated from another timeframe. empty means the chart timeframe is used.
line width
controls the thickness of the spaghetti lines.
show futuristic panel
shows or hides the ranking panel.
show token labels
shows or hides labels at the right side of the visible chart.
background zones
controls the green, yellow, and red performance zones.
rsi settings
controls the rsi length and the overbought, oversold, extreme overbought, and extreme oversold thresholds.
alert settings
allows each alert type to be enabled or disabled.
min bars between same alert type can reduce repeated alerts.
important notes
this indicator is designed for comparison, not prediction.
a high rank means relative strength inside the selected basket.
a low rank means relative weakness inside the selected basket.
rank can change quickly in volatile markets.
rsi extremes can stay extreme during strong trends.
always confirm signals with price action.
always use risk management.
always test settings before using them in live conditions.
risk notice
this tool is for technical analysis and educational use. it does not provide financial advice and does not guarantee any result. all readings, ranks, zones, and alerts are visual references only. every trader is responsible for their own analysis, risk management, and trading decisions.
the tool does not display normal price. instead, it rebases every selected token from the same lookback point and shows its relative performance as a percentage. this makes it easier to see which tokens are leading, which tokens are lagging, and where rotation is happening inside a crypto basket.
main idea
most traders look at one chart at a time. this tool helps compare many markets at once.
each line represents one token.
when a line is above zero, that token is performing better than its starting point over the selected lookback.
when a line is below zero, that token is performing weaker than its starting point over the selected lookback.
when one line rises faster than the others, that token is showing relative strength.
when one line falls faster than the others, that token is showing relative weakness.
what the indicator shows
performance lines
the script plots up to 40 crypto pairs as percentage performance lines. all pairs are rebased using the same lookback value, so they can be compared on the same scale.
zero line
the zero line is the base level. values above zero show positive performance from the rebase point. values below zero show negative performance from the rebase point.
background zones
the green area shows stronger positive performance.
the yellow area shows the neutral zone.
the red area shows weaker negative performance.
these zones are visual guides only. they help separate strong, neutral, and weak conditions.
rsi dots
small dots can appear on the lines when the selected token reaches rsi overbought, extreme overbought, oversold, or extreme oversold conditions.
these dots are not automatic buy or sell signals. they are momentum warnings.
panel
the panel shows each token with several useful readings:
pair: the selected crypto pair.
percent: the current relative performance.
rank: the current position of the token inside the 40-symbol basket.
zone: top, high, mid, low, or bottom.
rsi: the current rsi value.
sig: rsi status such as ob, xob, os, or xos.
rank and zone
rank shows where a token stands compared to the rest of the basket.
rank #1 means the strongest token in the current basket.
rank #40 means the weakest token in the current basket.
top means the current leader.
high means the token is inside the top group.
mid means the token is in the middle of the basket.
low means the token is inside the weak group.
bottom means the current weakest token.
this ranking system makes it easier to identify leaders and laggards without relying only on line colors.
alerts
the script includes dynamic alert logic using alert calls.
available alert logic includes:
new top token
new bottom token
token enters top 5
token enters bottom 5
top 5 token with rsi overbought or extreme overbought
bottom 5 token with rsi oversold or extreme oversold
performance crosses above the neutral top zone
performance crosses below the neutral bottom zone
to use these alerts, create a tradingview alert and select the condition:
any alert() function call
how to use the tool
step 1: choose the symbols
select the crypto pairs you want to compare. the default list includes major crypto assets and popular altcoins. you can replace any symbol with another pair.
step 2: choose the lookback
the rebase lookback controls how far back the comparison starts.
a shorter lookback gives a more reactive view.
a longer lookback gives a broader market rotation view.
for beginners, a lookback around 200 bars gives a balanced view.
step 3: read the zero line
tokens above zero are outperforming their own starting point.
tokens below zero are underperforming their own starting point.
tokens near zero are close to neutral.
step 4: check rank
rank is one of the most important readings.
a token ranked #1 is the current strongest performer in the selected basket.
a token ranked in the top 5 is part of the strongest group.
a token ranked in the bottom 5 is part of the weakest group.
step 5: check rsi status
if a token is top ranked and also shows ob or xob, it is strong but may be stretched.
if a token is bottom ranked and also shows os or xos, it is weak but may be stretched to the downside.
rsi does not replace price action. it only adds momentum context.
beginner examples
example 1: finding the strongest token
if sol is ranked #1 and its performance line is rising above the others, sol is currently leading the selected basket.
a beginner can use this information to focus analysis on sol instead of searching across many charts manually.
this does not mean immediate entry. the trader should still check structure, trend, support, resistance, and risk.
example 2: identifying weakness
if a token is ranked #40 and its line is deep in the red zone, it is the weakest token in the selected group.
this can help traders avoid weak assets during bullish conditions or watch for possible continuation weakness.
example 3: rotation
if btc was rank #1 and then eth becomes rank #1, the alert can show a top rotation.
this means leadership inside the basket has changed.
rotation can help traders understand where market attention is moving.
example 4: top 5 with rsi overbought
if a token enters the top 5 and rsi is overbought, the token is strong but potentially extended.
a beginner should not chase blindly. it is usually better to wait for a pullback, a clean continuation setup, or confirmation on the price chart.
example 5: bottom 5 with rsi oversold
if a token enters the bottom 5 and rsi is oversold, the token is weak and may be stretched.
this can be useful for studying possible capitulation, but it is not a buy signal by itself.
best use cases
market rotation analysis
crypto basket comparison
finding relative strength
finding relative weakness
spotting leaders and laggards
monitoring top 5 and bottom 5 changes
watching rsi extremes across many symbols
building a watchlist for further analysis
suggested beginner workflow
first, check the top 5.
then, check if those tokens are above zero.
then, check if they are still rising or already flat.
after that, open the normal price chart of the strongest token.
look for structure, trend, support, resistance, volume, and risk level.
do the same with the bottom 5 if you want to study weak markets.
do not trade only because a token is top ranked or bottom ranked.
the indicator is a scanner and comparison tool. it is not a full trading system.
settings explained
rebase lookback bars
sets how many bars are used as the starting point for the performance comparison.
smoothing
smooths the performance lines. higher values make the lines cleaner but slower.
use log-return style
uses log-style performance calculation instead of simple percentage calculation.
request timeframe
allows the comparison to be calculated from another timeframe. empty means the chart timeframe is used.
line width
controls the thickness of the spaghetti lines.
show futuristic panel
shows or hides the ranking panel.
show token labels
shows or hides labels at the right side of the visible chart.
background zones
controls the green, yellow, and red performance zones.
rsi settings
controls the rsi length and the overbought, oversold, extreme overbought, and extreme oversold thresholds.
alert settings
allows each alert type to be enabled or disabled.
min bars between same alert type can reduce repeated alerts.
important notes
this indicator is designed for comparison, not prediction.
a high rank means relative strength inside the selected basket.
a low rank means relative weakness inside the selected basket.
rank can change quickly in volatile markets.
rsi extremes can stay extreme during strong trends.
always confirm signals with price action.
always use risk management.
always test settings before using them in live conditions.
risk notice
this tool is for technical analysis and educational use. it does not provide financial advice and does not guarantee any result. all readings, ranks, zones, and alerts are visual references only. every trader is responsible for their own analysis, risk management, and trading decisions.
오픈 소스 스크립트
트레이딩뷰의 진정한 정신에 따라, 이 스크립트의 작성자는 이를 오픈소스로 공개하여 트레이더들이 기능을 검토하고 검증할 수 있도록 했습니다. 작성자에게 찬사를 보냅니다! 이 코드는 무료로 사용할 수 있지만, 코드를 재게시하는 경우 하우스 룰이 적용된다는 점을 기억하세요.

Light the candle that sleeps within you.
면책사항
해당 정보와 게시물은 금융, 투자, 트레이딩 또는 기타 유형의 조언이나 권장 사항으로 간주되지 않으며, 트레이딩뷰에서 제공하거나 보증하는 것이 아닙니다. 자세한 내용은 이용 약관을 참조하세요.
오픈 소스 스크립트
트레이딩뷰의 진정한 정신에 따라, 이 스크립트의 작성자는 이를 오픈소스로 공개하여 트레이더들이 기능을 검토하고 검증할 수 있도록 했습니다. 작성자에게 찬사를 보냅니다! 이 코드는 무료로 사용할 수 있지만, 코드를 재게시하는 경우 하우스 룰이 적용된다는 점을 기억하세요.
Light the candle that sleeps within you.
면책사항
해당 정보와 게시물은 금융, 투자, 트레이딩 또는 기타 유형의 조언이나 권장 사항으로 간주되지 않으며, 트레이딩뷰에서 제공하거나 보증하는 것이 아닙니다. 자세한 내용은 이용 약관을 참조하세요.