Universal MTF Pulse v2.0.1
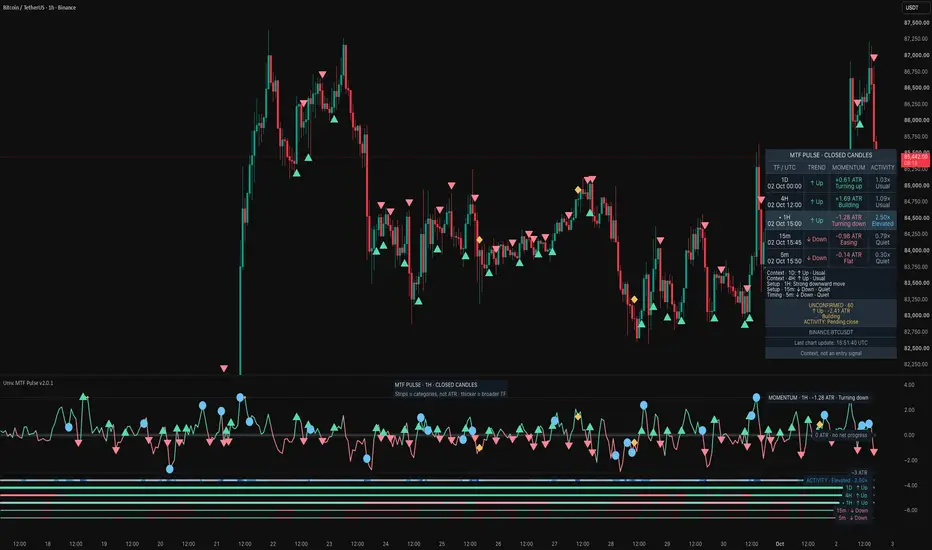
Universal MTF Pulse is a descriptive, five-timeframe view of trend, price movement, and trading activity. It lets you compare the latest completed 1D, 4H, 1H, 15m, and 5m candles without treating those readings as five independent votes or as a trading signal. It places no orders and provides no entries, exits, or alerts.
HOW THE READINGS ARE CALCULATED
• Trend: Up requires the source close above EMA50 and EMA50 above its value three source candles earlier. Down requires both relationships to be below; all other valid combinations are Mixed. This needs at least 53 source candles.
• Momentum: (source close − close three source candles earlier) / source ATR14. A reading of +1.0 means a three-candle net rise equal to one ATR. “Turning up/down” marks a change across zero beyond the flat band of 0.15 ATR. “Building/easing” compares the magnitude of consecutive ATR-normalized readings; a change in ATR can affect it, so it is not pure price acceleration.
• Activity: the completed source candle’s volume divided by the mean volume of the preceding 20 source candles, excluding the candle being measured. Below 0.8× is Quiet, 0.8–<1.5× Usual, 1.5–<2.5× Elevated, and 2.5× or more Surge. These are descriptive thresholds, not probabilities. Missing volume or an invalid baseline gives N/A.
• Three-bar path efficiency: absolute net close change divided by the sum of the three absolute close-to-close changes. A one-directional path is 100%; a round trip or valid flat path is 0%. It ignores movement inside each candle and is not a probability. The exact value is available in the Data Window and event tooltips.
HOW TO READ THE DISPLAY
The optional dashboard, off by default, can show each timeframe’s most recent closed source candle, its UTC close time, trend, momentum, and activity. It is a latest snapshot, not a crosshair readout. The lower pane’s wave shows momentum for the chart timeframe on confirmed chart candles. It is visually capped at ±3 ATR by default; clipped samples are marked and the uncapped number remains in the Data Window. The activity strip and five trend strips are categorical lanes; their vertical positions are not ATR values. Broader-timeframe strips are thicker by default, but width is customizable and does not indicate confidence. On a chart timeframe broader than a source timeframe, historical lower-timeframe states are sampled at chart closes rather than showing every intrabar change.
Optional triangles mark a momentum turn, dots the onset of Elevated-or-higher activity, and diamonds the onset of a Busy candle. “Busy / little progress” means at least 2.5× relative volume while that same candle’s body is under 0.25 ATR; it does not prove absorption. A “strong move” means at least 1 ATR of three-candle momentum with at least 1.5× relative volume. “Pullback” is negative momentum within an Up trend; “Bounce” is positive momentum within a Down trend. These labels describe current conditions, not what happens next. When events coincide, Busy has display priority, then a turn, then an activity onset.
For example, 4H Up alongside negative 1H momentum and a 5m activity surge shows a higher-timeframe uptrend with shorter-term disagreement and unusual volume. It is a prompt to inspect price structure and risk, not an automatic long.
LIMITATIONS
Pulse is intended for standard time-based candles and the selected symbol’s feed. Relative volume is not time-of-day adjusted and does not reveal trader count, buy/sell aggression, or market-wide flow. EMA, ATR, and volume measures need source history to warm up. Lower-timeframe requests are limited to 10,000 source bars, so older readings may be unavailable. The dashboard updates when chart data ticks; provider revisions or differences between live and reloaded data may change historical readings. No predictive edge or strategy performance is claimed.
HOW THE READINGS ARE CALCULATED
• Trend: Up requires the source close above EMA50 and EMA50 above its value three source candles earlier. Down requires both relationships to be below; all other valid combinations are Mixed. This needs at least 53 source candles.
• Momentum: (source close − close three source candles earlier) / source ATR14. A reading of +1.0 means a three-candle net rise equal to one ATR. “Turning up/down” marks a change across zero beyond the flat band of 0.15 ATR. “Building/easing” compares the magnitude of consecutive ATR-normalized readings; a change in ATR can affect it, so it is not pure price acceleration.
• Activity: the completed source candle’s volume divided by the mean volume of the preceding 20 source candles, excluding the candle being measured. Below 0.8× is Quiet, 0.8–<1.5× Usual, 1.5–<2.5× Elevated, and 2.5× or more Surge. These are descriptive thresholds, not probabilities. Missing volume or an invalid baseline gives N/A.
• Three-bar path efficiency: absolute net close change divided by the sum of the three absolute close-to-close changes. A one-directional path is 100%; a round trip or valid flat path is 0%. It ignores movement inside each candle and is not a probability. The exact value is available in the Data Window and event tooltips.
HOW TO READ THE DISPLAY
The optional dashboard, off by default, can show each timeframe’s most recent closed source candle, its UTC close time, trend, momentum, and activity. It is a latest snapshot, not a crosshair readout. The lower pane’s wave shows momentum for the chart timeframe on confirmed chart candles. It is visually capped at ±3 ATR by default; clipped samples are marked and the uncapped number remains in the Data Window. The activity strip and five trend strips are categorical lanes; their vertical positions are not ATR values. Broader-timeframe strips are thicker by default, but width is customizable and does not indicate confidence. On a chart timeframe broader than a source timeframe, historical lower-timeframe states are sampled at chart closes rather than showing every intrabar change.
Optional triangles mark a momentum turn, dots the onset of Elevated-or-higher activity, and diamonds the onset of a Busy candle. “Busy / little progress” means at least 2.5× relative volume while that same candle’s body is under 0.25 ATR; it does not prove absorption. A “strong move” means at least 1 ATR of three-candle momentum with at least 1.5× relative volume. “Pullback” is negative momentum within an Up trend; “Bounce” is positive momentum within a Down trend. These labels describe current conditions, not what happens next. When events coincide, Busy has display priority, then a turn, then an activity onset.
For example, 4H Up alongside negative 1H momentum and a 5m activity surge shows a higher-timeframe uptrend with shorter-term disagreement and unusual volume. It is a prompt to inspect price structure and risk, not an automatic long.
LIMITATIONS
Pulse is intended for standard time-based candles and the selected symbol’s feed. Relative volume is not time-of-day adjusted and does not reveal trader count, buy/sell aggression, or market-wide flow. EMA, ATR, and volume measures need source history to warm up. Lower-timeframe requests are limited to 10,000 source bars, so older readings may be unavailable. The dashboard updates when chart data ticks; provider revisions or differences between live and reloaded data may change historical readings. No predictive edge or strategy performance is claimed.

면책사항
해당 정보와 게시물은 금융, 투자, 트레이딩 또는 기타 유형의 조언이나 권장 사항으로 간주되지 않으며, 트레이딩뷰에서 제공하거나 보증하는 것이 아닙니다. 자세한 내용은 이용 약관을 참조하세요.
면책사항
해당 정보와 게시물은 금융, 투자, 트레이딩 또는 기타 유형의 조언이나 권장 사항으로 간주되지 않으며, 트레이딩뷰에서 제공하거나 보증하는 것이 아닙니다. 자세한 내용은 이용 약관을 참조하세요.