OPEN-SOURCE SCRIPT
NQ8020-GC0802
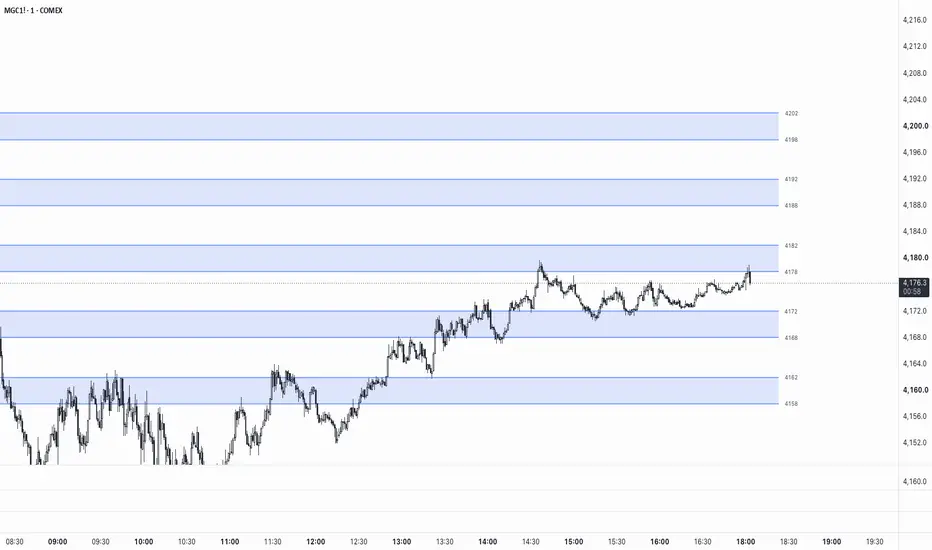
Round-Level Zones — Auto NQ/GC Support & Resistance Map
This indicator automatically maps out horizontal reaction zones around round-number price levels for Nasdaq (NQ/MNQ) and Gold (GC/MGC) futures, adjusting its logic to match the instrument you're viewing.
How it works
The script detects the symbol you're on and applies the appropriate round-level structure:
Zones re-center automatically as price moves, giving you a consistent, always-current map of nearby round-number levels without manually drawing lines on each instrument.
Features
Why round numbers matter
Round price levels tend to attract order flow — stops, limit orders, and psychological decision points cluster around them. Having these zones pre-mapped can help with spotting potential reaction areas, planning entries/exits, or keeping round-number context visible without cluttering the chart with manual drawings.
Usage notes
Designed specifically for the round-number structures of NQ/MNQ (hundreds) and GC/MGC (tens). This is a visual reference tool only and does not generate buy/sell signals — always combine with your own strategy, market structure analysis, and risk management.
This indicator automatically maps out horizontal reaction zones around round-number price levels for Nasdaq (NQ/MNQ) and Gold (GC/MGC) futures, adjusting its logic to match the instrument you're viewing.
How it works
The script detects the symbol you're on and applies the appropriate round-level structure:
- NQ / MNQ → zones are drawn from xx80 to xx20 around each round hundred (e.g. a zone at the 24,000 level runs from 24,020 down to 23,980)
- GC / MGC → zones are drawn from xx8 to xx2 around each round ten (e.g. a zone at 3350 runs from 3352 down to 3348)
Zones re-center automatically as price moves, giving you a consistent, always-current map of nearby round-number levels without manually drawing lines on each instrument.
Features
- Works on both NQ/MNQ and GC/MGC — no separate indicators or settings to switch
- Adjustable number of zones displayed above/below price (1–50)
- Customizable zone fill color, border line color, style (solid/dashed/dotted), and width
- Optional price labels on each zone boundary
- Adjustable right-side offset and left-extension of lines
- On-chart warning if applied to an unsupported symbol
Why round numbers matter
Round price levels tend to attract order flow — stops, limit orders, and psychological decision points cluster around them. Having these zones pre-mapped can help with spotting potential reaction areas, planning entries/exits, or keeping round-number context visible without cluttering the chart with manual drawings.
Usage notes
Designed specifically for the round-number structures of NQ/MNQ (hundreds) and GC/MGC (tens). This is a visual reference tool only and does not generate buy/sell signals — always combine with your own strategy, market structure analysis, and risk management.
오픈 소스 스크립트
트레이딩뷰의 진정한 정신에 따라, 이 스크립트의 작성자는 이를 오픈소스로 공개하여 트레이더들이 기능을 검토하고 검증할 수 있도록 했습니다. 작성자에게 찬사를 보냅니다! 이 코드는 무료로 사용할 수 있지만, 코드를 재게시하는 경우 하우스 룰이 적용된다는 점을 기억하세요.

면책사항
해당 정보와 게시물은 금융, 투자, 트레이딩 또는 기타 유형의 조언이나 권장 사항으로 간주되지 않으며, 트레이딩뷰에서 제공하거나 보증하는 것이 아닙니다. 자세한 내용은 이용 약관을 참조하세요.
오픈 소스 스크립트
트레이딩뷰의 진정한 정신에 따라, 이 스크립트의 작성자는 이를 오픈소스로 공개하여 트레이더들이 기능을 검토하고 검증할 수 있도록 했습니다. 작성자에게 찬사를 보냅니다! 이 코드는 무료로 사용할 수 있지만, 코드를 재게시하는 경우 하우스 룰이 적용된다는 점을 기억하세요.
면책사항
해당 정보와 게시물은 금융, 투자, 트레이딩 또는 기타 유형의 조언이나 권장 사항으로 간주되지 않으며, 트레이딩뷰에서 제공하거나 보증하는 것이 아닙니다. 자세한 내용은 이용 약관을 참조하세요.