OPEN-SOURCE SCRIPT
Big Trades Indicator By Revan Blezinsky
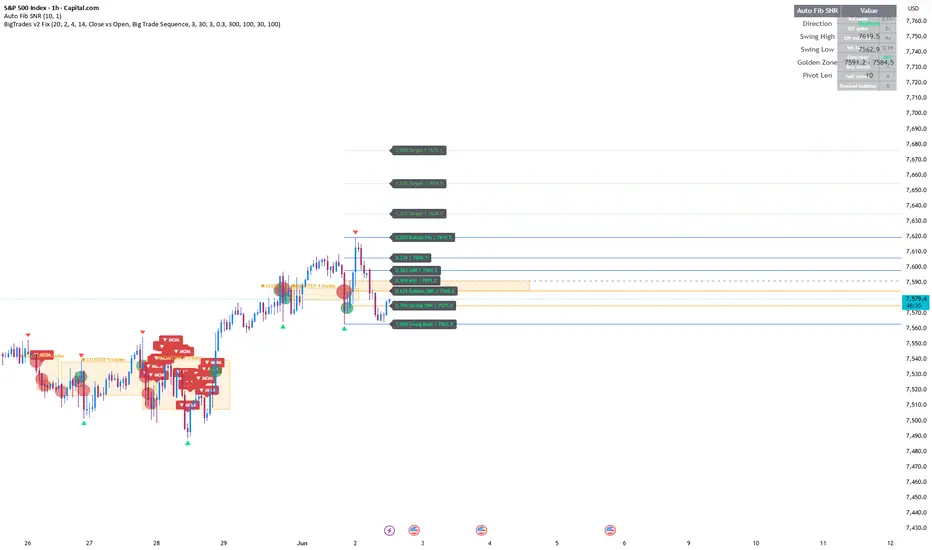
Big Trades Indicator v2 is a custom volume-based indicator designed to help traders identify unusual trading activity, large volume spikes, directional pressure, and potential liquidity clusters directly on the price chart.
The indicator compares current volume against the average volume and marks significant volume events with visual bubbles. The bigger the volume anomaly, the larger and more visible the bubble becomes.
Green bubbles represent estimated buy-side pressure, while red bubbles represent estimated sell-side pressure. Direction is estimated using candle behavior such as Close vs Open, Close vs Midpoint, or Close vs Previous Close.
This script also includes a momentum marker system. When multiple big trades appear in the same direction, the indicator displays a momentum marker to show repeated buying or selling pressure.
Another key feature is Liquidity Cluster Detection. When several large volume events happen within a narrow price range, the indicator highlights the area as a possible liquidity zone. These zones may act as potential support, resistance, accumulation, distribution, or breakout confirmation areas.
Key Features:
- Volume spike detection
- Extreme volume detection
- Buy and sell pressure estimation
- Optional ATR-based dynamic threshold
- Momentum marker for repeated directional pressure
- Liquidity cluster detection
- Smooth bubble opacity scaling
- Real-time information table
- Object management to reduce chart clutter
How to Read:
- Green bubble = estimated buy pressure
- Red bubble = estimated sell pressure
- Bigger bubble = stronger volume anomaly
- Cluster zone = multiple big trades around the same price area
- BUY MOM / SELL MOM = repeated big trades in the same direction
Recommended Usage:
This indicator is best used as a confirmation tool together with support and resistance, market structure, breakout analysis, price action, volume profile, and risk management.
Example:
A large green bubble near support may suggest aggressive buying or accumulation.
A large red bubble near resistance may suggest selling pressure or distribution.
A cluster near a breakout area may suggest strong market participation.
Important:
This indicator does not provide guaranteed buy or sell signals. Buy and sell pressure are estimated from candle behavior and volume, not from real order flow or exchange-level bid/ask data.
Large volume can indicate either continuation or exhaustion depending on market context. Always combine this indicator with proper analysis and risk management.
Suggested Settings for Stocks:
Volume MA Length: 20
Spike Threshold: 2.0
Extreme Threshold: 4.0
Dynamic Threshold: Off
Cluster Lookback: 30
Cluster Price Range: 0.3% - 0.5%
Suggested Settings for Crypto, Gold, or High Volatility Markets:
Volume MA Length: 20
Spike Threshold: 2.5
Extreme Threshold: 5.0
Dynamic Threshold: On
Cluster Lookback: 30 - 50
Cluster Price Range: 0.5% - 1.0%
Disclaimer:
This script is for educational and analytical purposes only. It is not financial advice. Always do your own research and use proper risk management before making any trading decision.
오픈 소스 스크립트
트레이딩뷰의 진정한 정신에 따라, 이 스크립트의 작성자는 이를 오픈소스로 공개하여 트레이더들이 기능을 검토하고 검증할 수 있도록 했습니다. 작성자에게 찬사를 보냅니다! 이 코드는 무료로 사용할 수 있지만, 코드를 재게시하는 경우 하우스 룰이 적용된다는 점을 기억하세요.

면책사항
해당 정보와 게시물은 금융, 투자, 트레이딩 또는 기타 유형의 조언이나 권장 사항으로 간주되지 않으며, 트레이딩뷰에서 제공하거나 보증하는 것이 아닙니다. 자세한 내용은 이용 약관을 참조하세요.
오픈 소스 스크립트
트레이딩뷰의 진정한 정신에 따라, 이 스크립트의 작성자는 이를 오픈소스로 공개하여 트레이더들이 기능을 검토하고 검증할 수 있도록 했습니다. 작성자에게 찬사를 보냅니다! 이 코드는 무료로 사용할 수 있지만, 코드를 재게시하는 경우 하우스 룰이 적용된다는 점을 기억하세요.
면책사항
해당 정보와 게시물은 금융, 투자, 트레이딩 또는 기타 유형의 조언이나 권장 사항으로 간주되지 않으며, 트레이딩뷰에서 제공하거나 보증하는 것이 아닙니다. 자세한 내용은 이용 약관을 참조하세요.