업데이트됨
Rainbow Cloud Levels
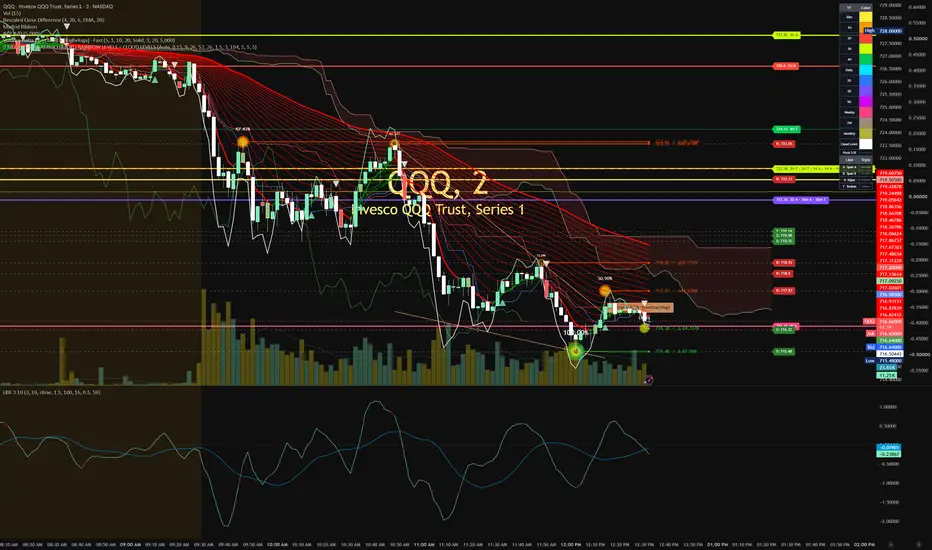
This is an attempt to identify strong levels of demand and supply using ichimoku senko a and senko b. If there is a level where frequent mini peaks and troughs are being made I call that a cluster level which I have coded an average followed by a plot of the level noted as cloud. When combined with other indicators this indicator becomes extremely powerful at identifying extreme areas of supply/demand on higher time frames D 4H 1H. Then I use the 15M/5M to enter for multi time frame sync. I included a color legend to identify the time frames by color. Once you get used to the color format you can toggle off. The script works well on higher time frames compressing the price chart slightly but on intraday the chart becomes very compressed and hard to see. If someone can fix this indicator that would be amazing. More ideas to come.
릴리즈 노트
Removed some lines that I didnt think were neccessary. Cloud lines are black or white depending on the mode. Cloud lines now show on intraday charts where as in the older script they did not.
면책사항
해당 정보와 게시물은 금융, 투자, 트레이딩 또는 기타 유형의 조언이나 권장 사항으로 간주되지 않으며, 트레이딩뷰에서 제공하거나 보증하는 것이 아닙니다. 자세한 내용은 이용 약관을 참조하세요.
면책사항
해당 정보와 게시물은 금융, 투자, 트레이딩 또는 기타 유형의 조언이나 권장 사항으로 간주되지 않으며, 트레이딩뷰에서 제공하거나 보증하는 것이 아닙니다. 자세한 내용은 이용 약관을 참조하세요.