OPEN-SOURCE SCRIPT
업데이트됨 Alpha Hunter Integrated MACD & Oscillator [wjdtks255]
Indicator Title: Alpha Hunter Integrated MACD & Oscillator Pro
Short Description
A high-precision hybrid oscillator that integrates MACD dynamics with a secondary-smoothed histogram to eliminate market noise and capture trend reversals with minimal lag.
Detailed Description
Overview
The Alpha Hunter Integrated MACD & Oscillator is designed to overcome the inherent lag of standard MACD indicators. By applying an exponential moving average (EMA) filter to the histogram itself and incorporating a momentum direction check, this tool identifies high-probability entry points while filtering out "whipsaws" commonly found in choppy markets.
Key Technical Pillars
Dual-Smoothed Histogram: Unlike standard oscillators, this script smooths the raw histogram values using a secondary filtering period. This reveals the true underlying momentum before price action fully shifts.
Momentum Directional Filter: Entry signals are only triggered when the MACD line’s slope aligns with the crossover, ensuring you don't enter against a stalling trend.
Dynamic Trend Clouds: The visual fill between the MACD and Signal lines acts as a "Trend Cloud," providing immediate visual feedback on the strength and duration of the current trend.
The Winning Trading Strategy (How to Use)
To maximize win rates, it is highly recommended to use this indicator as a Confirmation Oscillator alongside a Long-term Trend Filter (like a 200 EMA) on your main chart.
1. Long Setup (Buy)
Context: Price must be trading above the 200 EMA on the main chart.
Signal: A green "BUY" triangle and label appear on the oscillator.
Confirmation: The Histogram should be green and rising.
Exit: Exit at a pre-defined Take Profit (TP) box or when a bearish MACD crossunder occurs.
2. Short Setup (Sell)
Context: Price must be trading below the 200 EMA on the main chart.
Signal: A red "SELL" triangle and label appear on the oscillator.
Confirmation: The Histogram should be red and falling.
Exit: Exit at the designated Stop Loss (SL) or when a bullish MACD crossover occurs.
Input Parameters & Optimization
Fast/Slow/Signal: Default 12, 26, 9. (Standard for most markets).
Signal Smoothing: Set to 5 for a balance of speed and reliability. Increase to 8+ for swing trading on higher timeframes.
Recommended Timeframes: 15m, 1h, and 4h for the best signal-to-noise ratio.
Author's Note
This indicator is a "No-Repaint" script. Signals are confirmed at the close of the candle to ensure reliability during live trading. Always use proper risk management.
Short Description
A high-precision hybrid oscillator that integrates MACD dynamics with a secondary-smoothed histogram to eliminate market noise and capture trend reversals with minimal lag.
Detailed Description
Overview
The Alpha Hunter Integrated MACD & Oscillator is designed to overcome the inherent lag of standard MACD indicators. By applying an exponential moving average (EMA) filter to the histogram itself and incorporating a momentum direction check, this tool identifies high-probability entry points while filtering out "whipsaws" commonly found in choppy markets.
Key Technical Pillars
Dual-Smoothed Histogram: Unlike standard oscillators, this script smooths the raw histogram values using a secondary filtering period. This reveals the true underlying momentum before price action fully shifts.
Momentum Directional Filter: Entry signals are only triggered when the MACD line’s slope aligns with the crossover, ensuring you don't enter against a stalling trend.
Dynamic Trend Clouds: The visual fill between the MACD and Signal lines acts as a "Trend Cloud," providing immediate visual feedback on the strength and duration of the current trend.
The Winning Trading Strategy (How to Use)
To maximize win rates, it is highly recommended to use this indicator as a Confirmation Oscillator alongside a Long-term Trend Filter (like a 200 EMA) on your main chart.
1. Long Setup (Buy)
Context: Price must be trading above the 200 EMA on the main chart.
Signal: A green "BUY" triangle and label appear on the oscillator.
Confirmation: The Histogram should be green and rising.
Exit: Exit at a pre-defined Take Profit (TP) box or when a bearish MACD crossunder occurs.
2. Short Setup (Sell)
Context: Price must be trading below the 200 EMA on the main chart.
Signal: A red "SELL" triangle and label appear on the oscillator.
Confirmation: The Histogram should be red and falling.
Exit: Exit at the designated Stop Loss (SL) or when a bullish MACD crossover occurs.
Input Parameters & Optimization
Fast/Slow/Signal: Default 12, 26, 9. (Standard for most markets).
Signal Smoothing: Set to 5 for a balance of speed and reliability. Increase to 8+ for swing trading on higher timeframes.
Recommended Timeframes: 15m, 1h, and 4h for the best signal-to-noise ratio.
Author's Note
This indicator is a "No-Repaint" script. Signals are confirmed at the close of the candle to ensure reliability during live trading. Always use proper risk management.
릴리즈 노트
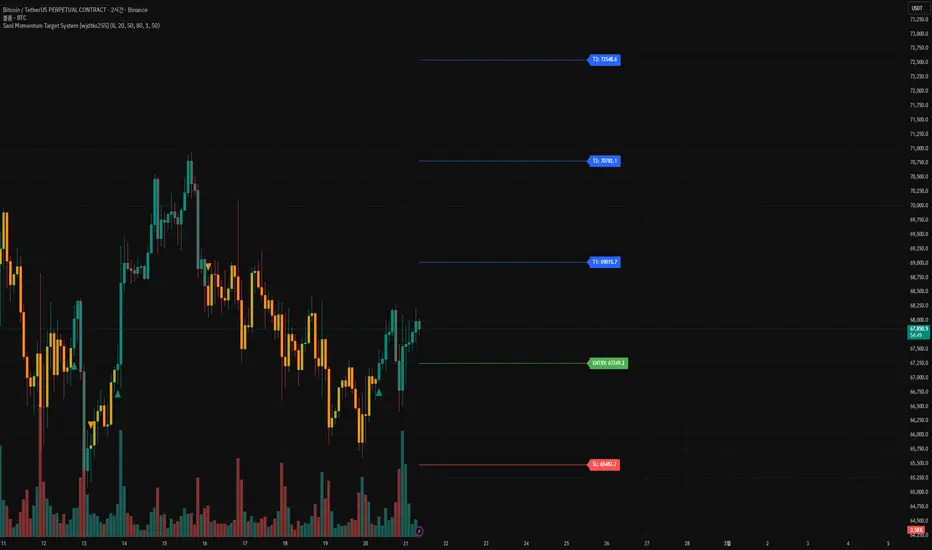
OverviewThe Sani Momentum Target System is a comprehensive trend-following execution tool. It goes beyond simple signal generation by providing a complete risk-management framework, automatically calculating Entry, Stop-Loss (SL), and three tiered Take-Profit (TP) levels based on market volatility.
Technical Logic & Originality
This script integrates three distinct analytical layers to provide high-precision trade setups
1.Volatility-Adaptive Smoothing: It utilizes a custom f_smooth function (an adaptive alpha-weighted filter) to clean price action data, which significantly reduces the lag typically found in standard moving averages.
2.Momentum Crossover Engine: The core signals are generated by the interaction between a fast/slow EMA pair and a secondary SMA signal line, all derived from the pre-processed 'Glide' data.
3.Dynamic Risk Projection: Unlike static target indicators, this system uses the ATR (Average True Range) to project SL and TP levels ($T1, T2, T3$). This ensures that targets are mathematically aligned with current market volatility (
 ATR \times Multiplier$).
Key Features
Automatic Levels: Upon a trend crossover, the script instantly plots horizontal extension lines for Entry, SL, and TP, allowing traders to visualize their R:R (Risk/Reward) ratio immediately.
Object Management Logic: Uses sophisticated line.new and label.new handling with custom clearing functions (f_clear_objects) to ensure the chart remains clean and only displays the most relevant setup.
Trend-Synced Coloring: The barcolor logic provides immediate visual feedback by syncing candle colors with the underlying momentum bias.
How to Use
Entry: When a Teal Triangle appears, a bullish trend is confirmed.
Targeting: Use the blue lines ($T1, T2, T3$) for scaling out of positions. $T1$ is for conservative exits, while $T3$ targets extended trend runs.
Risk Management: The red line (
 SL$) provides a volatility-backed stop level to protect capital.
오픈 소스 스크립트
트레이딩뷰의 진정한 정신에 따라, 이 스크립트의 작성자는 이를 오픈소스로 공개하여 트레이더들이 기능을 검토하고 검증할 수 있도록 했습니다. 작성자에게 찬사를 보냅니다! 이 코드는 무료로 사용할 수 있지만, 코드를 재게시하는 경우 하우스 룰이 적용된다는 점을 기억하세요.

면책사항
해당 정보와 게시물은 금융, 투자, 트레이딩 또는 기타 유형의 조언이나 권장 사항으로 간주되지 않으며, 트레이딩뷰에서 제공하거나 보증하는 것이 아닙니다. 자세한 내용은 이용 약관을 참조하세요.
오픈 소스 스크립트
트레이딩뷰의 진정한 정신에 따라, 이 스크립트의 작성자는 이를 오픈소스로 공개하여 트레이더들이 기능을 검토하고 검증할 수 있도록 했습니다. 작성자에게 찬사를 보냅니다! 이 코드는 무료로 사용할 수 있지만, 코드를 재게시하는 경우 하우스 룰이 적용된다는 점을 기억하세요.
면책사항
해당 정보와 게시물은 금융, 투자, 트레이딩 또는 기타 유형의 조언이나 권장 사항으로 간주되지 않으며, 트레이딩뷰에서 제공하거나 보증하는 것이 아닙니다. 자세한 내용은 이용 약관을 참조하세요.