US CPI & PPI Release Dates
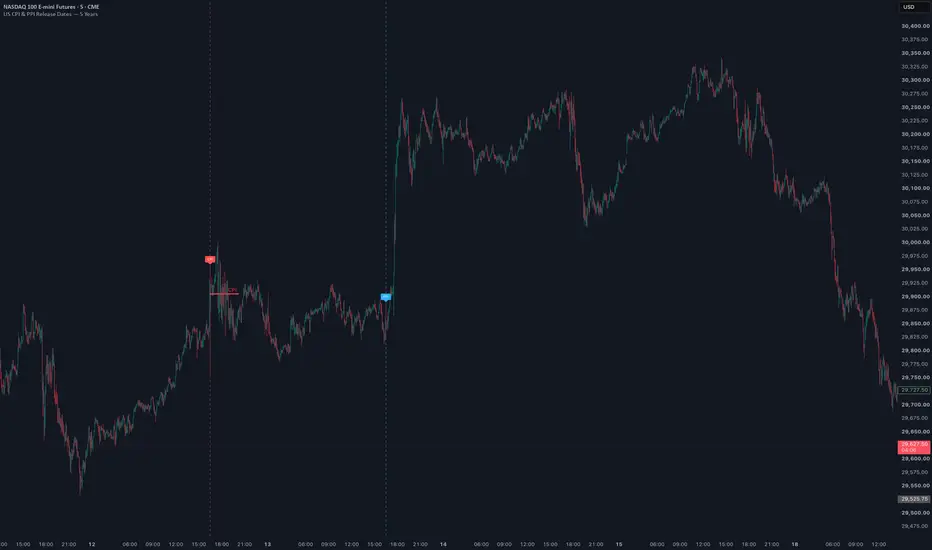
This indicator marks historical US Consumer Price Index (CPI) and Producer Price Index (PPI) release dates directly on the chart.
It includes five years of official release dates from the US Bureau of Labor Statistics. Each release is marked at 8:30 a.m. New York time, with daylight-saving changes handled automatically.
Features:
• Separate vertical markers for CPI and PPI
• CPI and PPI can be enabled or disabled independently
• Optional event labels
• Custom colours, line styles and line widths
• Works on intraday and higher-timeframe charts
CPI is shown in red and PPI in blue by default.
The release dates are embedded in the script because Pine Script cannot access TradingView’s economic calendar directly.
It includes five years of official release dates from the US Bureau of Labor Statistics. Each release is marked at 8:30 a.m. New York time, with daylight-saving changes handled automatically.
Features:
• Separate vertical markers for CPI and PPI
• CPI and PPI can be enabled or disabled independently
• Optional event labels
• Custom colours, line styles and line widths
• Works on intraday and higher-timeframe charts
CPI is shown in red and PPI in blue by default.
The release dates are embedded in the script because Pine Script cannot access TradingView’s economic calendar directly.

면책사항
해당 정보와 게시물은 금융, 투자, 트레이딩 또는 기타 유형의 조언이나 권장 사항으로 간주되지 않으며, 트레이딩뷰에서 제공하거나 보증하는 것이 아닙니다. 자세한 내용은 이용 약관을 참조하세요.
면책사항
해당 정보와 게시물은 금융, 투자, 트레이딩 또는 기타 유형의 조언이나 권장 사항으로 간주되지 않으며, 트레이딩뷰에서 제공하거나 보증하는 것이 아닙니다. 자세한 내용은 이용 약관을 참조하세요.