Drawdown Recovery Efficiency [Pineify]
Overview
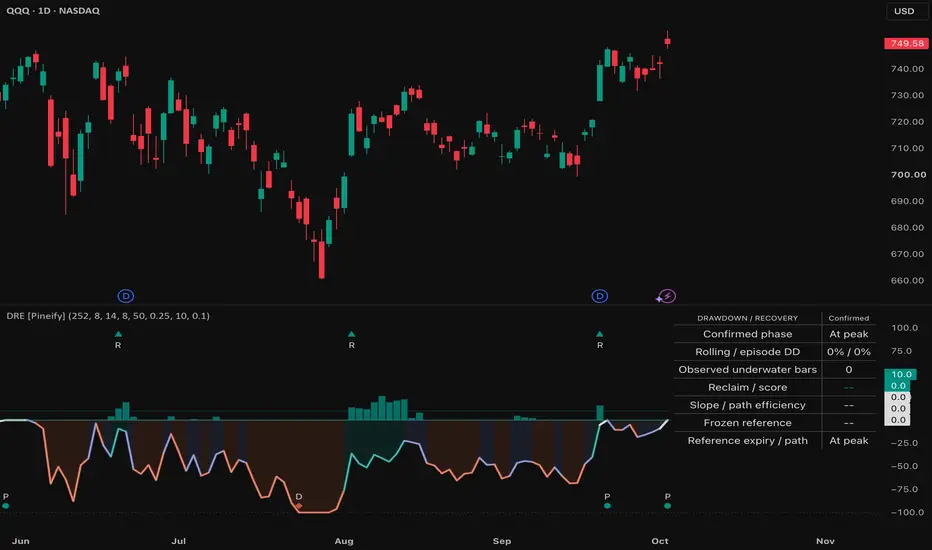
Drawdown Recovery Efficiency separates distance below a closing peak from the quality of the path back toward it. The underwater field compares rolling and frozen anchors; upper columns show recovery quality from 0 to 100.
Problem Definition
The same drawdown percentage can describe a quick rebound or a long, indecisive loss. When an old high leaves a rolling window, drawdown can shrink even if price is flat. A depth-only chart can therefore confuse reference expiry with economic recovery. This script requires price to reclaim a retained peak before ending an observed underwater episode.
Design Rationale
The rolling peak preserves familiar finite-window context, while freezing the episode anchor prevents expiry from manufacturing a recovery. A recent ATR-normalized slope measures speed; net upward movement divided by absolute travel discounts zigzag paths. Reclaimed distance and an age penalty constrain those inputs to the actual loss episode. A sum was rejected because speed could compensate for no progress. Multiplication can suppress slow but valid rebounds. Entry and half-entry exit thresholds reduce phase flicker.
Key Features
The pane shows episode depth, optional rolling depth and violet expiry gap, recovery columns and an entry threshold. The optional table reports raw loss, age, reclaim, slope and anchor. D, R and P mark confirmed deep loss, recovery entry and peak reclaim.
How It Works
The reference is the highest close over the peak window. After full valid coverage, the first underwater close freezes it. Confirmed closes update the trough and age; only a close reaching the anchor ends the episode.
Recovery slope is recent net price rise divided by path length and previous-bar ATR. Upward path efficiency is positive net rise divided by summed absolute close changes. Reclaim is distance above the episode trough divided by anchor-to-trough loss. Duration weight is 1 / (1 + underwater bars / duration setting).
Score is 100 times capped positive slope credit, path efficiency, reclaim and age weight. Credit starts only after the full path lies inside the observed episode. New troughs or slope below -0.02 ATR/bar imply declining; sufficient positive score and reclaim imply recovering; other underwater observations imply basing. Rolling-peak expiry never clears the anchor.
Depth lanes are -100 times drawdown divided by the deep threshold, clipped at -100; raw percentages remain in the table and Data Window. Missing or invalid OHLC, nonpositive closes or unusable ATR hide outputs and reset episode memory.
How Multiple Indicators Work Together
These components describe one recovery process. Depth establishes the loss, the frozen anchor defines genuine progress, slope measures its pace, and path efficiency distinguishes directed advance from churn. Reclaim prevents a fast but tiny bounce from earning full credit; duration reduces credit for prolonged underwater residence. Removing the anchor would reintroduce expiry-based false recovery.
Trading Ideas and Insights
A rising rolling line beside a flat episode line can indicate reference expiry rather than buying progress. Rising score and a recovering phase identify a stronger observed path, while falling score can expose churn before full depth recovery. Compare these readings with independent market context; a deep-loss event or recovery entry is not a trade instruction.
Unique Aspects
Relative to a conventional rolling drawdown curve, the structural addition is retained episode memory plus a conjunctive recovery score. A disappearing rolling high can improve the baseline curve while the anchor, age and phase remain unresolved. The ribbon exposes expiry; true reclaim is independent of the rolling denominator.
How to Use
Use standard OHLC charts, initially on 1H-1W timeframes. Read the lower basin as normalized loss and the upper columns as recovery quality. Check raw percentage and duration in the table before interpreting a clipped basin. The displayed phase is confirmed; live values may differ. Configure the three alerts for once per bar close.
Customization
Defaults of 252 peak bars, 8 path bars and 14 ATR bars are starting points. Longer peaks retain context; shorter paths react sooner with more noise. Deep-loss threshold controls both the depth alert and lane scaling. The 50-bar duration setting halves age weight at 50 bars. Full-slope credit, entry score and minimum reclaim tune recovery requirements. Rolling comparison, background, markers and table can be switched separately.
Assumptions and Limitations
This measures instrument price drawdown, not account equity or total return including dividends. It uses closing peaks, so intrabar extremes are excluded. ATR and path windows introduce lag; settings and timeframe change the result. Very old episodes may never reach the recovery entry score before reclaim. After loading or reset, age starts at the first valid observed episode and can understate an existing loss. Raw values and columns change intrabar; memory, phases and alerts update only on confirmed closes. Depth clipping conceals additional visual magnitude, and synthetic charts or adjusted history can alter interpretation.
Conclusion
Use the retained anchor to distinguish a return toward a peak from rolling-reference expiry. Recovery efficiency summarizes observed pace, direction, progress and time cost; it provides no forecast, execution rule or performance guarantee.
Drawdown Recovery Efficiency separates distance below a closing peak from the quality of the path back toward it. The underwater field compares rolling and frozen anchors; upper columns show recovery quality from 0 to 100.
Problem Definition
The same drawdown percentage can describe a quick rebound or a long, indecisive loss. When an old high leaves a rolling window, drawdown can shrink even if price is flat. A depth-only chart can therefore confuse reference expiry with economic recovery. This script requires price to reclaim a retained peak before ending an observed underwater episode.
Design Rationale
The rolling peak preserves familiar finite-window context, while freezing the episode anchor prevents expiry from manufacturing a recovery. A recent ATR-normalized slope measures speed; net upward movement divided by absolute travel discounts zigzag paths. Reclaimed distance and an age penalty constrain those inputs to the actual loss episode. A sum was rejected because speed could compensate for no progress. Multiplication can suppress slow but valid rebounds. Entry and half-entry exit thresholds reduce phase flicker.
Key Features
The pane shows episode depth, optional rolling depth and violet expiry gap, recovery columns and an entry threshold. The optional table reports raw loss, age, reclaim, slope and anchor. D, R and P mark confirmed deep loss, recovery entry and peak reclaim.
How It Works
The reference is the highest close over the peak window. After full valid coverage, the first underwater close freezes it. Confirmed closes update the trough and age; only a close reaching the anchor ends the episode.
Recovery slope is recent net price rise divided by path length and previous-bar ATR. Upward path efficiency is positive net rise divided by summed absolute close changes. Reclaim is distance above the episode trough divided by anchor-to-trough loss. Duration weight is 1 / (1 + underwater bars / duration setting).
Score is 100 times capped positive slope credit, path efficiency, reclaim and age weight. Credit starts only after the full path lies inside the observed episode. New troughs or slope below -0.02 ATR/bar imply declining; sufficient positive score and reclaim imply recovering; other underwater observations imply basing. Rolling-peak expiry never clears the anchor.
Depth lanes are -100 times drawdown divided by the deep threshold, clipped at -100; raw percentages remain in the table and Data Window. Missing or invalid OHLC, nonpositive closes or unusable ATR hide outputs and reset episode memory.
How Multiple Indicators Work Together
These components describe one recovery process. Depth establishes the loss, the frozen anchor defines genuine progress, slope measures its pace, and path efficiency distinguishes directed advance from churn. Reclaim prevents a fast but tiny bounce from earning full credit; duration reduces credit for prolonged underwater residence. Removing the anchor would reintroduce expiry-based false recovery.
Trading Ideas and Insights
A rising rolling line beside a flat episode line can indicate reference expiry rather than buying progress. Rising score and a recovering phase identify a stronger observed path, while falling score can expose churn before full depth recovery. Compare these readings with independent market context; a deep-loss event or recovery entry is not a trade instruction.
Unique Aspects
Relative to a conventional rolling drawdown curve, the structural addition is retained episode memory plus a conjunctive recovery score. A disappearing rolling high can improve the baseline curve while the anchor, age and phase remain unresolved. The ribbon exposes expiry; true reclaim is independent of the rolling denominator.
How to Use
Use standard OHLC charts, initially on 1H-1W timeframes. Read the lower basin as normalized loss and the upper columns as recovery quality. Check raw percentage and duration in the table before interpreting a clipped basin. The displayed phase is confirmed; live values may differ. Configure the three alerts for once per bar close.
Customization
Defaults of 252 peak bars, 8 path bars and 14 ATR bars are starting points. Longer peaks retain context; shorter paths react sooner with more noise. Deep-loss threshold controls both the depth alert and lane scaling. The 50-bar duration setting halves age weight at 50 bars. Full-slope credit, entry score and minimum reclaim tune recovery requirements. Rolling comparison, background, markers and table can be switched separately.
Assumptions and Limitations
This measures instrument price drawdown, not account equity or total return including dividends. It uses closing peaks, so intrabar extremes are excluded. ATR and path windows introduce lag; settings and timeframe change the result. Very old episodes may never reach the recovery entry score before reclaim. After loading or reset, age starts at the first valid observed episode and can understate an existing loss. Raw values and columns change intrabar; memory, phases and alerts update only on confirmed closes. Depth clipping conceals additional visual magnitude, and synthetic charts or adjusted history can alter interpretation.
Conclusion
Use the retained anchor to distinguish a return toward a peak from rolling-reference expiry. Recovery efficiency summarizes observed pace, direction, progress and time cost; it provides no forecast, execution rule or performance guarantee.

🚀🚀🚀 Pineify - pineify.app
Essential Toolkit for Every Trader
- AI Pine Script Generator
- Finance AI Agent
- AI Stock Picker
- Pine Script Visual Editor
- Invited indicators
- Strategy Optimizer
- Trading Journal
- Backtest Report
Essential Toolkit for Every Trader
- AI Pine Script Generator
- Finance AI Agent
- AI Stock Picker
- Pine Script Visual Editor
- Invited indicators
- Strategy Optimizer
- Trading Journal
- Backtest Report
면책사항
해당 정보와 게시물은 금융, 투자, 트레이딩 또는 기타 유형의 조언이나 권장 사항으로 간주되지 않으며, 트레이딩뷰에서 제공하거나 보증하는 것이 아닙니다. 자세한 내용은 이용 약관을 참조하세요.
🚀🚀🚀 Pineify - pineify.app
Essential Toolkit for Every Trader
- AI Pine Script Generator
- Finance AI Agent
- AI Stock Picker
- Pine Script Visual Editor
- Invited indicators
- Strategy Optimizer
- Trading Journal
- Backtest Report
Essential Toolkit for Every Trader
- AI Pine Script Generator
- Finance AI Agent
- AI Stock Picker
- Pine Script Visual Editor
- Invited indicators
- Strategy Optimizer
- Trading Journal
- Backtest Report
면책사항
해당 정보와 게시물은 금융, 투자, 트레이딩 또는 기타 유형의 조언이나 권장 사항으로 간주되지 않으며, 트레이딩뷰에서 제공하거나 보증하는 것이 아닙니다. 자세한 내용은 이용 약관을 참조하세요.