OPEN-SOURCE SCRIPT
Repainting Statistics: Displayed vs Tradeable Win Rate
Repainting means that an indicator draws or changes signals on bars
that have already closed, using information that did not exist when
those bars closed. Before you trust an indicator whose arrows mark
every top and bottom - or a backtest built on such arrows - this script
shows how much of that performance hindsight alone can create, on any
chart.
On randomly generated price bars - data with no trend and no pattern to
find - a pivot-reversal arrow showed a 75.84% win rate. The same arrow,
entered at the first moment it was actually visible on a live chart,
won 50.0% - the coin flip that random data must produce. The 25.9-point
gap is the repainting premium.
On real market data - a crypto pair, an FX pair and an equity index
future - the premium at the default settings is 18.9 percentage points
of win rate. That is the average amount by which the displayed history
of a repainting signal overstates what a real-time user of the same
signal could have achieved.
This script measures the two kinds of repainting that place future
information onto past bars: signals computed from data that had not yet
happened, and signals drawn backwards onto earlier bars with a plot
offset. A third kind - signals that appear and disappear while the live
bar is still forming - is a separate phenomenon and is out of scope
here. This script itself does not repaint: every marker it draws is
created only after the signal is confirmed, and is never moved.
The measurements behind this publication were made on BTCUSDT (crypto),
EURUSD (forex) and ES1! (an equity index future). The script runs on any
symbol and timeframe.
What to Use It For
Putting a number on a widely known warning. Traders are routinely
warned that repainting indicators look better than they perform. The
warning is correct, but it usually comes without a number. This script
produces the number, on your chart, with a method you can audit row by
row in its panel.
Understanding what a hindsight chart is worth. Arrows planted at
exact tops and bottoms - ZigZag-style reversal markers, fractal arrows
drawn several bars back - are the most common repainting signals. The
script scores the same signal twice on the same bars: where history
draws it, and where a live user could first have acted on it. The
difference is what the hindsight display is worth.
Testing before trusting. If a signal on your chart is drawn
in the past - the arrow sits several bars behind the bar where it first
appeared - this measurement applies to it. The pivot rule used here is
the cleanest representative of that family, with the hindsight distance
as an explicit setting, so you can see how the premium grows as signals
are drawn deeper into the past.

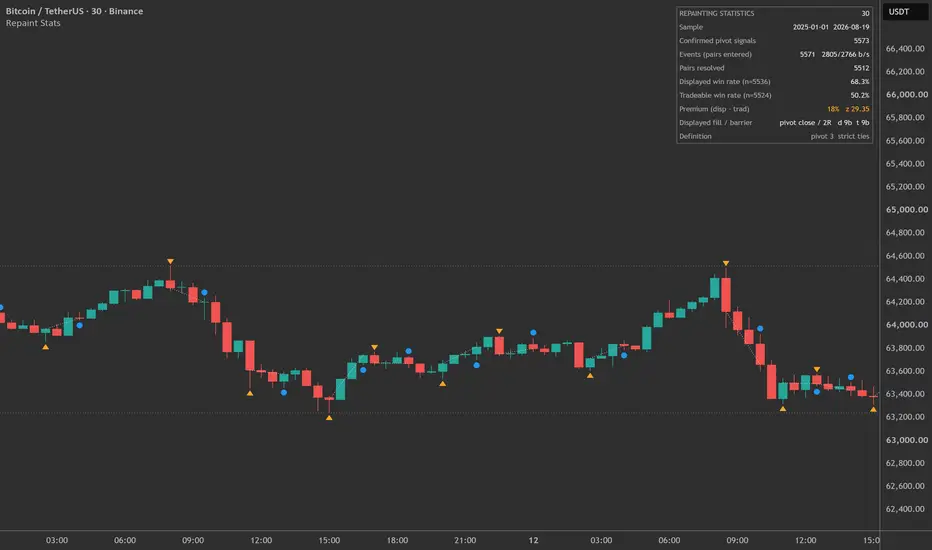
A pivot-reversal signal on a real chart. The orange triangle is the
displayed placement: history draws the signal at the exact swing bar.
The circle marks the confirmation bar: the first bar on which the signal
was actually knowable in real time. The dotted line connects the two -
the bars in between are the hindsight gap. The panel scores every such
pair on the loaded chart - 5,512 of them here, not just the two visible
- in both ways and reports the difference.
The Result in Plain Language
Every tested configuration showed a large, positive repainting premium.
Across three instruments at the default settings, the displayed version
of the signal won 18.9 percentage points more often than the tradeable
version of the same signal - about 68% against about 50%. The result
repeated on every instrument, on two timeframes, and in a separate
calendar year that shares no data with the main test window.
The deeper the hindsight, the larger the premium: painting the signal 2
bars into the past cost 13.1 points; painting it 10 bars back cost 34.5
points. Filling the trade at the exact swing price - which is what a
naive backtest of a repainting signal does - nearly doubled the premium
compared with filling at the signal bar's close.
The tradeable version of the signal, meanwhile, stayed at the baseline
in every cell. The gap between the two versions is not produced by the
rule finding good trades. It is produced by where history draws them.
Terms Used in the Panel
Displayed arm. The trade as the chart's history shows it: entry
at the close of the bar where the signal is drawn - the pivot bar, the
swing bar the arrow points at - even though the signal did not exist yet
on that bar.
Tradeable arm. The same signal entered at the close of the bar
where it first became knowable - the confirmation bar. This is the best
a real-time user of the signal could have done.
Premium ("disp - trad"). The displayed arm's win rate minus the
tradeable arm's win rate, in percentage points. This is the primary
result: the part of the displayed performance that hindsight placement
alone creates.
Percentage point (pp). An absolute difference between
percentages: 68% minus 50% is 18 percentage points.
Discordant pairs. Events where the two arms disagreed - one won
and the other lost. The premium's z score comes from a paired test
(McNemar's test) on exactly these events: it asks whether the
disagreements favour one arm more often than chance allows. A paired
test is used because both arms trade the same events on the same price
path, so their outcomes rise and fall together.
z score. The result divided by a measure of its statistical noise.
As a widely used threshold, an absolute z score above 2 is treated as a
first sign of a real effect; this study also required the result to
repeat on two more instruments before calling it a finding.
95% confidence interval (95% CI). A range around the estimate
showing its uncertainty. When the range excludes zero, the direction of
the effect is established at that confidence level.
Ambiguous outcome. A bar whose range contains both the target and
the stop. Bar data cannot show which was reached first, so the case is
counted against the win rate - the safe choice.
Censored outcome. A trade that reached neither barrier before the
time limit. It is reported separately and leaves the paired comparison;
a pair only counts when both arms produced a real outcome.
Replay errors. An internal integrity counter for the part of the
measurement that reconstructs the displayed arm's trade from closed
bars. It must read 0; any other value voids the run and says so.
The Rule Being Measured
A pivot low is a bar whose low is strictly below the lows of a set
number of bars on each side - the pivot length. A pivot high is the
mirror image. In this script a pivot low is a long signal and a pivot
high a short signal, ties disqualify the bar, and the test uses the
strict definition throughout.
A pivot with length 3 can only be recognised 3 bars after the pivot bar
prints: its definition depends on the bars that come after it. History
nevertheless draws the signal at the pivot bar. That gap - the signal
exists in the display 3 bars before it existed in reality - is not a
flaw of one particular indicator. It is the defining feature of the
whole family of reversal markers this rule represents, and its size is
the pivot length, which makes the hindsight distance measurable as a
setting rather than an accident.
How the Measurement Works
Both arms of every pair use one shared risk unit: the average true range
(ATR) measured at the pivot bar. Average true range is roughly how far
price typically travels in one bar, so barriers set in ATR mean the same
thing on a volatile instrument and a quiet one. A barrier size of 2R
places a target and a stop two risk units from the entry, one on each
side.
The displayed arm enters at the pivot bar's close. The tradeable arm
enters at the confirmation bar's close. Each arm then races its own
symmetric barriers: whichever of the target or stop is reached first
decides the outcome, with a time limit for trades that reach neither.
Entries are recorded at closes because a bar's high or low has no known
time inside the bar; a close is a defined moment.
The displayed arm's early bars are reconstructed at confirmation time
from bars that have already closed. Nothing about the measurement uses
future data; the future data is entirely inside the thing being
measured - the entry placement.
Why the displayed arm cannot help winning more. A pivot low is,
by definition, lower than every low for the next several bars. So while
the displayed trade runs through those bars, price cannot reach a stop
placed at or below the pivot low - but it can reach the target. Losing
outcomes are suppressed during the hindsight gap; winning outcomes are
not. The panel shows this directly: the displayed arm's average adverse
excursion (how far a trade goes against the entry before resolving) is
0.56-0.61R across the baseline cells, while the tradeable arm's is
0.85-0.89R on the same events.

The built-in validation. Price is replaced internally with a random walk
that contains no signal by construction, so the correct answer is known:
the tradeable arm must win 50%, and here it reads 50.2% with a
confidence interval containing 50. The displayed arm wins 76.1% on this
run of the test. The premium exists before any market data is involved,
because it is a property of hindsight placement, not of markets.
Results
The study contains 18 runs: 4 validation runs on synthetic data and 14
market runs producing 15 estimates. All 15 market estimates are
positive, ranging from +12.2 to +34.5 percentage points, with the
smallest z score at +12.8. The smallest difference the design can
detect is about 1 percentage point, measured on data with no edge.
The decision rule was fixed before any market run: an absolute z score
above 2 on one configuration, plus a repeat of the result on the two
other instruments, before anything counts as a finding. The rule was
met in full.
Baseline configuration, 30 minutes, 2025-01-01 to 2026-08-01:
Pine Script®
A heterogeneity check (Cochran's Q, which asks whether the three
instruments disagree more than sampling noise allows) does not reject
pooling: Q 4.43, p 0.11.
The same three instruments, 1-hour timeframe: +17.4, +20.6 and +20.1
points - each within one point of its 30-minute counterpart. At 1 hour
the heterogeneity check is marginal (Q 6.02, p 0.049), so the 1-hour
result is reported as the range +17.4 to +20.6 rather than as one
pooled number.
Calendar year 2024, which shares no data with the window above: +15.8,
+18.0 and +18.9 points, pooled +17.3 (95% CI +15.8 to +18.7, Q p 0.19).
The premium grows with hindsight depth. On BTCUSDT 30m, changing
only the pivot length - how many bars into the past the signal is
drawn:
Pine Script®
The relationship is strictly monotone, and it was stated as the expected
pattern in the study design before any run: a longer protected gap
suppresses more losing outcomes. A measurement artifact would have no
reason to follow the dose this way.
The premium shrinks as barriers widen. Same events, scored at
three barrier sizes: +29.4 points at 1R, +18.0 at 2R, +12.2 at 3R. The
hindsight gap protects a fixed number of bars; a wider barrier makes the
race last longer, so the protected bars are a smaller share of it.
Filling at the arrow price nearly doubles the premium. The
default displayed fill is the signal bar's close. Filling at the pivot's
exact extreme instead - which is what a backtest that trusts the arrows
does - raises the premium from +18.0 to +34.2 points on the same
events. The displayed arm's average adverse excursion collapses to
0.28R: trades that appear to suffer almost no drawdown. In that
configuration, across 5,349 pairs, there was not a single event where
the tradeable arm won and the displayed arm lost. That is exactly what
the geometry requires, and it serves as an additional consistency check
on the measurement.
The tradeable arm stayed at its baseline everywhere. In all nine
baseline market cells its win rate was between 49.3% and 51.2%, and its
confidence interval contained 50% every time. This is reported as a
property of the measurement design, not as a claim about pivot trading;
see the limitations.
To reproduce the published figures: the script defaults match the
baseline configuration. Switch the date range on (2025-01-01 to
2026-08-01), disable compact panel mode, and load the full chart
history. The three instruments are BTCUSDT, EURUSD and ES1!.
Validation
Known-answer test. Synthetic mode replaces price internally with
a random walk that contains no signal, so the correct answers are known
in advance: the tradeable arm must win 50%, and the displayed arm must
win more - if either fails, the measurement is broken. Across three
seeds (three different artificial price series), the tradeable arm
pooled to 49.96% on 11,637 pairs, within a twentieth of a point of 50%,
with every seed's confidence interval containing 50%. The displayed arm
pooled to 75.84%. The premium on data with no edge: +25.9 points.
Drift stress test. The same test repeated with a steady upward
drift added to the artificial data. Drift moved the long and short win
rates apart, as it must - the tradeable arm read 59.0% long and 41.3%
short - but the premium barely moved: +24.9 points against +25.9
driftless. Both arms inherit the drift, and it cancels in the pairing.
This is the test that shows the premium is not a trend artifact.

The drift stress test. Artificial data with a steady upward drift and
still no signal by construction. Drift splits the tradeable arm's two
directions apart - 59.0% long against 41.3% short - exactly as a trend
must. The premium is nearly unchanged: +24.9 points against +25.9
without drift, because both arms inherit the drift and it cancels in
the pairing. Synthetic mode replaces price internally, so the chart
behind the panel does not show the tested data.
Resolution. On no-edge data the design resolves differences down
to about 1 percentage point. Every market estimate in this study is at
least twelve times that floor.
Accounting. The panel reconciles every confirmed pivot into
exactly one category (measured, out of range, no ATR available, or
filtered), reports any mismatch as an explicit error, and carries a
replay-error counter that must read zero. Across all 18 runs, every
reconciliation was exact and every replay-error count was zero.
Settings
Signal definition. Pivot length sets how many bars on each side
define a pivot - and with it, how far into the past the displayed signal
is drawn. Minimum separation optionally rejects events too close to the
previous one.
Measurement. ATR length sets the risk unit. Barrier size sets the
target and stop distance in risk units. The time limit censors trades
that reach neither barrier. Displayed fill chooses where the displayed
arm enters: the pivot bar's close (default) or the pivot's exact extreme
(labelled biased; it adds the fill bias on top of the placement bias).
Sample. The date range uses explicit year, month and day fields
rather than a date picker, so a published sample can be reproduced
exactly.
Validation. Synthetic mode, seed, step size and drift per bar.
Display. Compact panel mode, the signal markers with their gap
lines, and the marker size.
Limitations
One rule family was measured. The pivot-reversal signal is the
cleanest and most common representative of hindsight placement, but
other repainting mechanisms - such as higher-timeframe data requested
with lookahead - share the deception without being measured here. The
numbers in this description apply to the measured rule.
The tradeable arm's 50% is not a verdict on pivot trading. This
design pairs two versions of one rule; it contains no control for the
rule itself, so it cannot say whether pivot reversals have or lack an
edge against other entries. The premium - the difference between the
two versions - is the only claim.
Long/short splits are unreliable under trend. In the drift test,
drift displaced the two directions' win rates by about nine points each
way while the aggregate premium held. Read the aggregate rows; treat
directional splits as descriptive.
Instruments may differ by a small amount. BTCUSDT showed the
lowest premium in every window, and at 1 hour the heterogeneity check
was marginal. A real instrument-level spread of roughly two points
around +19 is possible. No cell was below +12.
Loaded chart history bounds every sample. The number of bars the
chart loads, not only the calendar range, limits each run. The windows
and sample sizes are stated per cell above.
Historical measurement is not a forecast. The script reports what
happened under the specified rules and samples. It does not predict the
future behavior of any signal or instrument.
Disclaimer
This script and its description are provided for educational and
research purposes only. They do not constitute financial, investment,
trading or other professional advice, and they do not recommend buying,
selling or holding any asset. Historical and simulated results do not
guarantee future performance. Trading involves risk, including the
possible loss of capital. You are solely responsible for your trading
and investment decisions and should conduct your own research and,
where appropriate, consult a qualified financial professional.
that have already closed, using information that did not exist when
those bars closed. Before you trust an indicator whose arrows mark
every top and bottom - or a backtest built on such arrows - this script
shows how much of that performance hindsight alone can create, on any
chart.
On randomly generated price bars - data with no trend and no pattern to
find - a pivot-reversal arrow showed a 75.84% win rate. The same arrow,
entered at the first moment it was actually visible on a live chart,
won 50.0% - the coin flip that random data must produce. The 25.9-point
gap is the repainting premium.
On real market data - a crypto pair, an FX pair and an equity index
future - the premium at the default settings is 18.9 percentage points
of win rate. That is the average amount by which the displayed history
of a repainting signal overstates what a real-time user of the same
signal could have achieved.
This script measures the two kinds of repainting that place future
information onto past bars: signals computed from data that had not yet
happened, and signals drawn backwards onto earlier bars with a plot
offset. A third kind - signals that appear and disappear while the live
bar is still forming - is a separate phenomenon and is out of scope
here. This script itself does not repaint: every marker it draws is
created only after the signal is confirmed, and is never moved.
The measurements behind this publication were made on BTCUSDT (crypto),
EURUSD (forex) and ES1! (an equity index future). The script runs on any
symbol and timeframe.
What to Use It For
Putting a number on a widely known warning. Traders are routinely
warned that repainting indicators look better than they perform. The
warning is correct, but it usually comes without a number. This script
produces the number, on your chart, with a method you can audit row by
row in its panel.
Understanding what a hindsight chart is worth. Arrows planted at
exact tops and bottoms - ZigZag-style reversal markers, fractal arrows
drawn several bars back - are the most common repainting signals. The
script scores the same signal twice on the same bars: where history
draws it, and where a live user could first have acted on it. The
difference is what the hindsight display is worth.
Testing before trusting. If a signal on your chart is drawn
in the past - the arrow sits several bars behind the bar where it first
appeared - this measurement applies to it. The pivot rule used here is
the cleanest representative of that family, with the hindsight distance
as an explicit setting, so you can see how the premium grows as signals
are drawn deeper into the past.
A pivot-reversal signal on a real chart. The orange triangle is the
displayed placement: history draws the signal at the exact swing bar.
The circle marks the confirmation bar: the first bar on which the signal
was actually knowable in real time. The dotted line connects the two -
the bars in between are the hindsight gap. The panel scores every such
pair on the loaded chart - 5,512 of them here, not just the two visible
- in both ways and reports the difference.
The Result in Plain Language
Every tested configuration showed a large, positive repainting premium.
Across three instruments at the default settings, the displayed version
of the signal won 18.9 percentage points more often than the tradeable
version of the same signal - about 68% against about 50%. The result
repeated on every instrument, on two timeframes, and in a separate
calendar year that shares no data with the main test window.
The deeper the hindsight, the larger the premium: painting the signal 2
bars into the past cost 13.1 points; painting it 10 bars back cost 34.5
points. Filling the trade at the exact swing price - which is what a
naive backtest of a repainting signal does - nearly doubled the premium
compared with filling at the signal bar's close.
The tradeable version of the signal, meanwhile, stayed at the baseline
in every cell. The gap between the two versions is not produced by the
rule finding good trades. It is produced by where history draws them.
Terms Used in the Panel
Displayed arm. The trade as the chart's history shows it: entry
at the close of the bar where the signal is drawn - the pivot bar, the
swing bar the arrow points at - even though the signal did not exist yet
on that bar.
Tradeable arm. The same signal entered at the close of the bar
where it first became knowable - the confirmation bar. This is the best
a real-time user of the signal could have done.
Premium ("disp - trad"). The displayed arm's win rate minus the
tradeable arm's win rate, in percentage points. This is the primary
result: the part of the displayed performance that hindsight placement
alone creates.
Percentage point (pp). An absolute difference between
percentages: 68% minus 50% is 18 percentage points.
Discordant pairs. Events where the two arms disagreed - one won
and the other lost. The premium's z score comes from a paired test
(McNemar's test) on exactly these events: it asks whether the
disagreements favour one arm more often than chance allows. A paired
test is used because both arms trade the same events on the same price
path, so their outcomes rise and fall together.
z score. The result divided by a measure of its statistical noise.
As a widely used threshold, an absolute z score above 2 is treated as a
first sign of a real effect; this study also required the result to
repeat on two more instruments before calling it a finding.
95% confidence interval (95% CI). A range around the estimate
showing its uncertainty. When the range excludes zero, the direction of
the effect is established at that confidence level.
Ambiguous outcome. A bar whose range contains both the target and
the stop. Bar data cannot show which was reached first, so the case is
counted against the win rate - the safe choice.
Censored outcome. A trade that reached neither barrier before the
time limit. It is reported separately and leaves the paired comparison;
a pair only counts when both arms produced a real outcome.
Replay errors. An internal integrity counter for the part of the
measurement that reconstructs the displayed arm's trade from closed
bars. It must read 0; any other value voids the run and says so.
The Rule Being Measured
A pivot low is a bar whose low is strictly below the lows of a set
number of bars on each side - the pivot length. A pivot high is the
mirror image. In this script a pivot low is a long signal and a pivot
high a short signal, ties disqualify the bar, and the test uses the
strict definition throughout.
A pivot with length 3 can only be recognised 3 bars after the pivot bar
prints: its definition depends on the bars that come after it. History
nevertheless draws the signal at the pivot bar. That gap - the signal
exists in the display 3 bars before it existed in reality - is not a
flaw of one particular indicator. It is the defining feature of the
whole family of reversal markers this rule represents, and its size is
the pivot length, which makes the hindsight distance measurable as a
setting rather than an accident.
How the Measurement Works
Both arms of every pair use one shared risk unit: the average true range
(ATR) measured at the pivot bar. Average true range is roughly how far
price typically travels in one bar, so barriers set in ATR mean the same
thing on a volatile instrument and a quiet one. A barrier size of 2R
places a target and a stop two risk units from the entry, one on each
side.
The displayed arm enters at the pivot bar's close. The tradeable arm
enters at the confirmation bar's close. Each arm then races its own
symmetric barriers: whichever of the target or stop is reached first
decides the outcome, with a time limit for trades that reach neither.
Entries are recorded at closes because a bar's high or low has no known
time inside the bar; a close is a defined moment.
The displayed arm's early bars are reconstructed at confirmation time
from bars that have already closed. Nothing about the measurement uses
future data; the future data is entirely inside the thing being
measured - the entry placement.
Why the displayed arm cannot help winning more. A pivot low is,
by definition, lower than every low for the next several bars. So while
the displayed trade runs through those bars, price cannot reach a stop
placed at or below the pivot low - but it can reach the target. Losing
outcomes are suppressed during the hindsight gap; winning outcomes are
not. The panel shows this directly: the displayed arm's average adverse
excursion (how far a trade goes against the entry before resolving) is
0.56-0.61R across the baseline cells, while the tradeable arm's is
0.85-0.89R on the same events.
The built-in validation. Price is replaced internally with a random walk
that contains no signal by construction, so the correct answer is known:
the tradeable arm must win 50%, and here it reads 50.2% with a
confidence interval containing 50. The displayed arm wins 76.1% on this
run of the test. The premium exists before any market data is involved,
because it is a property of hindsight placement, not of markets.
Results
The study contains 18 runs: 4 validation runs on synthetic data and 14
market runs producing 15 estimates. All 15 market estimates are
positive, ranging from +12.2 to +34.5 percentage points, with the
smallest z score at +12.8. The smallest difference the design can
detect is about 1 percentage point, measured on data with no edge.
The decision rule was fixed before any market run: an absolute z score
above 2 on one configuration, plus a repeat of the result on the two
other instruments, before anything counts as a finding. The rule was
met in full.
Baseline configuration, 30 minutes, 2025-01-01 to 2026-08-01:
A heterogeneity check (Cochran's Q, which asks whether the three
instruments disagree more than sampling noise allows) does not reject
pooling: Q 4.43, p 0.11.
The same three instruments, 1-hour timeframe: +17.4, +20.6 and +20.1
points - each within one point of its 30-minute counterpart. At 1 hour
the heterogeneity check is marginal (Q 6.02, p 0.049), so the 1-hour
result is reported as the range +17.4 to +20.6 rather than as one
pooled number.
Calendar year 2024, which shares no data with the window above: +15.8,
+18.0 and +18.9 points, pooled +17.3 (95% CI +15.8 to +18.7, Q p 0.19).
The premium grows with hindsight depth. On BTCUSDT 30m, changing
only the pivot length - how many bars into the past the signal is
drawn:
The relationship is strictly monotone, and it was stated as the expected
pattern in the study design before any run: a longer protected gap
suppresses more losing outcomes. A measurement artifact would have no
reason to follow the dose this way.
The premium shrinks as barriers widen. Same events, scored at
three barrier sizes: +29.4 points at 1R, +18.0 at 2R, +12.2 at 3R. The
hindsight gap protects a fixed number of bars; a wider barrier makes the
race last longer, so the protected bars are a smaller share of it.
Filling at the arrow price nearly doubles the premium. The
default displayed fill is the signal bar's close. Filling at the pivot's
exact extreme instead - which is what a backtest that trusts the arrows
does - raises the premium from +18.0 to +34.2 points on the same
events. The displayed arm's average adverse excursion collapses to
0.28R: trades that appear to suffer almost no drawdown. In that
configuration, across 5,349 pairs, there was not a single event where
the tradeable arm won and the displayed arm lost. That is exactly what
the geometry requires, and it serves as an additional consistency check
on the measurement.
The tradeable arm stayed at its baseline everywhere. In all nine
baseline market cells its win rate was between 49.3% and 51.2%, and its
confidence interval contained 50% every time. This is reported as a
property of the measurement design, not as a claim about pivot trading;
see the limitations.
To reproduce the published figures: the script defaults match the
baseline configuration. Switch the date range on (2025-01-01 to
2026-08-01), disable compact panel mode, and load the full chart
history. The three instruments are BTCUSDT, EURUSD and ES1!.
Validation
Known-answer test. Synthetic mode replaces price internally with
a random walk that contains no signal, so the correct answers are known
in advance: the tradeable arm must win 50%, and the displayed arm must
win more - if either fails, the measurement is broken. Across three
seeds (three different artificial price series), the tradeable arm
pooled to 49.96% on 11,637 pairs, within a twentieth of a point of 50%,
with every seed's confidence interval containing 50%. The displayed arm
pooled to 75.84%. The premium on data with no edge: +25.9 points.
Drift stress test. The same test repeated with a steady upward
drift added to the artificial data. Drift moved the long and short win
rates apart, as it must - the tradeable arm read 59.0% long and 41.3%
short - but the premium barely moved: +24.9 points against +25.9
driftless. Both arms inherit the drift, and it cancels in the pairing.
This is the test that shows the premium is not a trend artifact.
The drift stress test. Artificial data with a steady upward drift and
still no signal by construction. Drift splits the tradeable arm's two
directions apart - 59.0% long against 41.3% short - exactly as a trend
must. The premium is nearly unchanged: +24.9 points against +25.9
without drift, because both arms inherit the drift and it cancels in
the pairing. Synthetic mode replaces price internally, so the chart
behind the panel does not show the tested data.
Resolution. On no-edge data the design resolves differences down
to about 1 percentage point. Every market estimate in this study is at
least twelve times that floor.
Accounting. The panel reconciles every confirmed pivot into
exactly one category (measured, out of range, no ATR available, or
filtered), reports any mismatch as an explicit error, and carries a
replay-error counter that must read zero. Across all 18 runs, every
reconciliation was exact and every replay-error count was zero.
Settings
Signal definition. Pivot length sets how many bars on each side
define a pivot - and with it, how far into the past the displayed signal
is drawn. Minimum separation optionally rejects events too close to the
previous one.
Measurement. ATR length sets the risk unit. Barrier size sets the
target and stop distance in risk units. The time limit censors trades
that reach neither barrier. Displayed fill chooses where the displayed
arm enters: the pivot bar's close (default) or the pivot's exact extreme
(labelled biased; it adds the fill bias on top of the placement bias).
Sample. The date range uses explicit year, month and day fields
rather than a date picker, so a published sample can be reproduced
exactly.
Validation. Synthetic mode, seed, step size and drift per bar.
Display. Compact panel mode, the signal markers with their gap
lines, and the marker size.
Limitations
One rule family was measured. The pivot-reversal signal is the
cleanest and most common representative of hindsight placement, but
other repainting mechanisms - such as higher-timeframe data requested
with lookahead - share the deception without being measured here. The
numbers in this description apply to the measured rule.
The tradeable arm's 50% is not a verdict on pivot trading. This
design pairs two versions of one rule; it contains no control for the
rule itself, so it cannot say whether pivot reversals have or lack an
edge against other entries. The premium - the difference between the
two versions - is the only claim.
Long/short splits are unreliable under trend. In the drift test,
drift displaced the two directions' win rates by about nine points each
way while the aggregate premium held. Read the aggregate rows; treat
directional splits as descriptive.
Instruments may differ by a small amount. BTCUSDT showed the
lowest premium in every window, and at 1 hour the heterogeneity check
was marginal. A real instrument-level spread of roughly two points
around +19 is possible. No cell was below +12.
Loaded chart history bounds every sample. The number of bars the
chart loads, not only the calendar range, limits each run. The windows
and sample sizes are stated per cell above.
Historical measurement is not a forecast. The script reports what
happened under the specified rules and samples. It does not predict the
future behavior of any signal or instrument.
Disclaimer
This script and its description are provided for educational and
research purposes only. They do not constitute financial, investment,
trading or other professional advice, and they do not recommend buying,
selling or holding any asset. Historical and simulated results do not
guarantee future performance. Trading involves risk, including the
possible loss of capital. You are solely responsible for your trading
and investment decisions and should conduct your own research and,
where appropriate, consult a qualified financial professional.
오픈 소스 스크립트
트레이딩뷰의 진정한 정신에 따라, 이 스크립트의 작성자는 이를 오픈소스로 공개하여 트레이더들이 기능을 검토하고 검증할 수 있도록 했습니다. 작성자에게 찬사를 보냅니다! 이 코드는 무료로 사용할 수 있지만, 코드를 재게시하는 경우 하우스 룰이 적용된다는 점을 기억하세요.

Algolego Studio · independent, placebo-controlled reviews of backtested strategies, in plain language · algolegostudio.com."
면책사항
해당 정보와 게시물은 금융, 투자, 트레이딩 또는 기타 유형의 조언이나 권장 사항으로 간주되지 않으며, 트레이딩뷰에서 제공하거나 보증하는 것이 아닙니다. 자세한 내용은 이용 약관을 참조하세요.
오픈 소스 스크립트
트레이딩뷰의 진정한 정신에 따라, 이 스크립트의 작성자는 이를 오픈소스로 공개하여 트레이더들이 기능을 검토하고 검증할 수 있도록 했습니다. 작성자에게 찬사를 보냅니다! 이 코드는 무료로 사용할 수 있지만, 코드를 재게시하는 경우 하우스 룰이 적용된다는 점을 기억하세요.
Algolego Studio · independent, placebo-controlled reviews of backtested strategies, in plain language · algolegostudio.com."
면책사항
해당 정보와 게시물은 금융, 투자, 트레이딩 또는 기타 유형의 조언이나 권장 사항으로 간주되지 않으며, 트레이딩뷰에서 제공하거나 보증하는 것이 아닙니다. 자세한 내용은 이용 약관을 참조하세요.