업데이트됨
SBP Structured Scalping Indicator
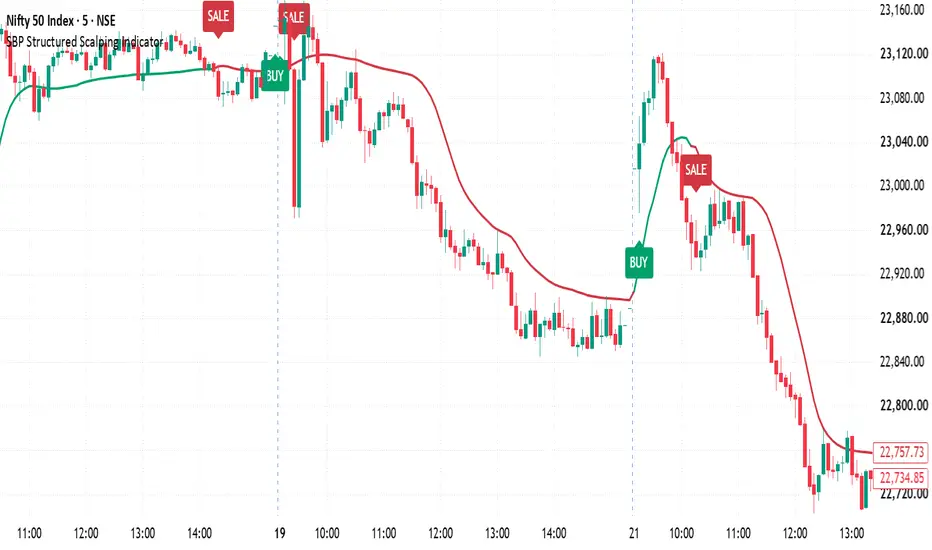
SBP Structured Scalping Indicator
SBP Structured Scalping Indicator is a market-structure and short-turn analysis framework designed to identify selective BUY and SELL observations around developing price turns.
The script is not a simple moving-average crossover mashup. Its purpose is to combine differently timed market observations into a single major-turn framework. A volatility-responsive adaptive trend identifies directional colour changes, while confirmed swing context and recent local extremes study whether that change is occurring near a meaningful price turning area.
Because a confirmed pivot and an adaptive trend change may not occur on the same candle, the script uses a short event-memory window to evaluate their proximity. A local-extreme fallback also studies recent highs or lows and requires a configurable ATR-based price excursion before the area can qualify as meaningful.
Potential turns are then evaluated using a confirmation score derived from adaptive-trend position, Dynamic Trend Filter direction, normalized momentum, candle direction, and liquidity or premium/discount context. Minimum signal spacing and alternating signal-state logic are used to reduce repetitive labels.
The Premium / Discount framework builds a dealing range from confirmed structural highs and lows and displays straight Premium, Equilibrium and Discount reference levels. These levels can be used as visual context or, when enabled, as an additional signal-location filter.
The two-colour Adaptive Trend Line changes between bullish and bearish states only when its confirmed slope exceeds a volatility-adjusted threshold. BUY and SELL signals are plotted on the confirmation bar; the primary signals do not use negative offsets.
Main settings
Minimum Signal Gap controls spacing between major-turn signals. Increasing it produces fewer, more widely separated observations.
Minimum Turn Confirmation Score controls how many supporting conditions are required. A higher value is more selective; a lower value increases sensitivity.
Local Extreme Lookback changes the recent high/low observation range.
Minimum Major Turn Excursion ATR controls how much prior price movement is required before a local extreme can qualify as a meaningful turn area.
Signal Window After Colour Change and Maximum Bars From Swing control the short event-memory relationship between adaptive turns and swing context.
Use Confirmed Swing Context evaluates confirmed pivot proximity. Use Local Extreme Fallback allows meaningful recent extremes to supplement pivot context. Use Premium / Discount Bias restricts BUY observations toward Discount and SELL observations toward Premium.
Optional structure, swing, CHoCH and liquidity displays are included for analysis and can be hidden to maintain a clean chart.
The indicator is intended as an analytical framework for studying short-term market structure, directional transitions and price-location context. Signals are observations generated from the framework's conditions and should be evaluated with the trader's own risk management and trading plan.
SBP Structured Scalping Indicator is a market-structure and short-turn analysis framework designed to identify selective BUY and SELL observations around developing price turns.
The script is not a simple moving-average crossover mashup. Its purpose is to combine differently timed market observations into a single major-turn framework. A volatility-responsive adaptive trend identifies directional colour changes, while confirmed swing context and recent local extremes study whether that change is occurring near a meaningful price turning area.
Because a confirmed pivot and an adaptive trend change may not occur on the same candle, the script uses a short event-memory window to evaluate their proximity. A local-extreme fallback also studies recent highs or lows and requires a configurable ATR-based price excursion before the area can qualify as meaningful.
Potential turns are then evaluated using a confirmation score derived from adaptive-trend position, Dynamic Trend Filter direction, normalized momentum, candle direction, and liquidity or premium/discount context. Minimum signal spacing and alternating signal-state logic are used to reduce repetitive labels.
The Premium / Discount framework builds a dealing range from confirmed structural highs and lows and displays straight Premium, Equilibrium and Discount reference levels. These levels can be used as visual context or, when enabled, as an additional signal-location filter.
The two-colour Adaptive Trend Line changes between bullish and bearish states only when its confirmed slope exceeds a volatility-adjusted threshold. BUY and SELL signals are plotted on the confirmation bar; the primary signals do not use negative offsets.
Main settings
Minimum Signal Gap controls spacing between major-turn signals. Increasing it produces fewer, more widely separated observations.
Minimum Turn Confirmation Score controls how many supporting conditions are required. A higher value is more selective; a lower value increases sensitivity.
Local Extreme Lookback changes the recent high/low observation range.
Minimum Major Turn Excursion ATR controls how much prior price movement is required before a local extreme can qualify as a meaningful turn area.
Signal Window After Colour Change and Maximum Bars From Swing control the short event-memory relationship between adaptive turns and swing context.
Use Confirmed Swing Context evaluates confirmed pivot proximity. Use Local Extreme Fallback allows meaningful recent extremes to supplement pivot context. Use Premium / Discount Bias restricts BUY observations toward Discount and SELL observations toward Premium.
Optional structure, swing, CHoCH and liquidity displays are included for analysis and can be hidden to maintain a clean chart.
The indicator is intended as an analytical framework for studying short-term market structure, directional transitions and price-location context. Signals are observations generated from the framework's conditions and should be evaluated with the trader's own risk management and trading plan.
릴리즈 노트
SBP Structured Scalping Indicator is a rule-based technical analysis indicator designed to identify potential short-term market phase transitions using a structured analytical workflow. Rather than relying on a single condition, the indicator evaluates multiple market characteristics before displaying a BUY or SELL signal. Its objective is to highlight qualified directional changes while reducing repetitive signals during the same market phase.The indicator combines trend direction, adaptive price behaviour, confirmed turning-point analysis, momentum, volatility, price acceptance and market structure into one integrated decision process. Each component contributes to the final evaluation instead of functioning as a separate standalone indicator.
Methodology
The analytical process begins by identifying confirmed swing highs and swing lows to establish the current market structure. These turning points are used to construct dynamic phase boundaries that adapt as new price information becomes available.
An adaptive direction model evaluates whether market conditions are improving or weakening by analysing changes in trend behaviour rather than relying on a fixed moving average crossover alone. Additional confirmation is obtained through price acceptance relative to an adaptive baseline together with momentum and volatility measurements.
Potential transition candidates are then evaluated using a weighted qualification process that considers:
Adaptive trend direction
Market phase structure
Confirmed turning-point context
Momentum strength
Candle quality
Volatility conditions
Dynamic phase location
Reversal behaviour
Recent market extremes
Only candidates that satisfy the required qualification criteria are considered for display.
Unified Signal Engine
The indicator uses a unified signal engine that combines several internally evaluated transition conditions into a single BUY or SELL output. Multiple analytical pathways may contribute to the same final signal, but only one consolidated BUY or SELL marker is displayed on the chart.
To reduce repeated signals during the same directional move, the indicator follows a strict sequential logic:
BUY → SELL → BUY → SELL
A new BUY cannot be displayed until a qualifying SELL has occurred, and a new SELL cannot be displayed until a qualifying BUY has occurred. An adjustable minimum signal spacing is also applied to reduce excessive signal clustering during volatile market conditions.
Optional Analytical Tools
The indicator includes optional visual tools that can be enabled or disabled independently, including:
Dynamic phase boundaries
Adaptive direction line
Confirmed turning points
Higher High / Higher Low / Lower High / Lower Low labels
Aligned turning-point signals
Secondary turning-point signals
Reference structure levels
These optional visual elements are intended to provide additional analytical context and do not replace the primary BUY and SELL signals.
Intended Use
The indicator is intended as an analytical decision-support tool for traders who prefer a structured, rules-based approach to short-term market analysis. It may be used alongside a trader's own market analysis, risk management rules and trade execution plan.
Signals are generated only after the indicator's internal qualification process has been satisfied. Users should evaluate signals within the broader market context and according to their own trading methodology.
Important Notes
This script is an analytical indicator and not a trading strategy.
It does not place trades or generate automated orders.
It does not calculate position sizing, portfolio allocation or risk management.
Signals should not be interpreted as guarantees of future market direction.
Past signals are provided for analytical reference only and do not imply future performance.
The indicator is designed to assist chart analysis by presenting a structured interpretation of current market conditions. Final trading decisions remain entirely the responsibility of the user.
릴리즈 노트
SBP Structured Scalping IndicatorSBP Structured Scalping Indicator is a rule-based technical analysis indicator that evaluates price structure, directional context, momentum, volatility, and price-action characteristics within a single analytical framework. Its purpose is to highlight potential BUY and SALE market conditions using objective calculations derived from historical price data.
The indicator identifies significant swing points through pivot analysis and evaluates each swing using multiple structural characteristics, including price rejection, movement relative to recent market volatility, and trend context. These structural observations are then combined with adaptive directional analysis, momentum measurements, and price acceptance before a BUY or SALE mark can be displayed.
Rather than displaying independent outputs from several separate calculations, the indicator combines its internal measurements into one integrated decision process. Structural continuation, directional transition, rejection-based price behaviour, trend alignment, and momentum are evaluated together so that each displayed BUY or SALE mark reflects the combined outcome of the complete analytical workflow.
The adaptive trendline provides directional context by responding to changing market conditions. Additional internal measurements evaluate momentum, candle characteristics, and structural behaviour relative to recent market activity. No individual calculation independently determines the displayed output; each contributes to the overall analytical process.
To improve chart readability, the indicator maintains a single alternating sequence of BUY and SALE marks. After a BUY mark is displayed, another BUY mark is not displayed until the analytical conditions for a SALE are satisfied, and vice versa. A configurable minimum spacing between displayed marks further reduces repetitive observations during sustained directional market phases.
The indicator automatically adjusts selected internal parameters according to the chosen market profile, allowing the same analytical methodology to be applied across different asset classes while preserving a consistent evaluation process. Users may customise basic visual settings, including trendline display, colours, and the minimum spacing between displayed BUY and SALE marks.
This script is an analytical indicator and does not place trades, manage positions, calculate risk, or provide investment advice. BUY and SALE marks represent the outcome of the indicator's internal calculations based solely on completed historical price data available at the time of evaluation. Market conditions can change rapidly, and no indicator should be used as the sole basis for trading decisions. Users should evaluate the information provided by this script together with their own analysis, risk management practices, and understanding of market conditions.
This publication is intended to provide a structured method for analysing market behaviour and should be used for educational and analytical purposes.
릴리즈 노트
SBP Structured Scalping Indicator is a rule-based analytical indicator designed to identify directional regime transitions using a single integrated calculation framework. Rather than relying on one technical study or presenting several unrelated tools together, the script evaluates multiple characteristics of market behaviour through one sequential workflow before displaying a BUY or SALE signal.The analytical process begins by selecting an internal parameter profile according to the TradingView symbol classification or an optional manually selected trading style. This profile adjusts the calculation lengths used throughout the indicator so that the same methodology can be applied consistently across different asset classes without requiring separate versions of the script.
The indicator then evaluates trend structure using multiple exponential moving averages that represent short-term, intermediate and primary directional movement. These trend measurements are combined with an ATR-based adaptive price channel whose width automatically expands or contracts according to prevailing market volatility. As volatility changes, the channel adjusts proportionally, allowing breakout conditions to be evaluated relative to current market conditions rather than a fixed distance from price.
Before a signal can be considered, the script measures directional quality by analysing moving-average alignment together with the strength of the prevailing trend. Trend measurements are normalised relative to current volatility so that directional quality is evaluated using a consistent scale across instruments with different price ranges and volatility characteristics.
A potential bullish or bearish transition must satisfy the complete qualification process before it is accepted. This includes directional alignment, adaptive channel confirmation, trend-quality requirements and breakout validation. The indicator then applies a state-driven regime engine that maintains the current directional state until sufficient evidence exists to confirm a transition into the opposite regime.
Signals are intentionally managed through this regime state rather than allowing repeated signals in the same direction. After a bullish regime has been established, additional BUY signals are not generated simply because price continues moving higher. Likewise, after a bearish regime has been confirmed, additional SELL signals are suppressed until the analytical conditions indicate that the market has transitioned into a new directional phase. This behaviour is intended to reduce repetitive signalling during sustained trends while highlighting confirmed changes in market direction.
The script also plots an Adaptive Regime Guide that provides a continuously updated visual reference derived from the internal trend model, adaptive volatility measurements and the active regime state. The guide is designed to illustrate the current analytical regime and should be interpreted as contextual information rather than as a fixed support, resistance or stop-loss level.
For users who prefer confirmed signals, the indicator includes an option to evaluate conditions only after candle close. When this option is enabled, signals are confirmed using completed bars. If disabled, conditions may change while the current candle is still forming.
This script is an analytical indicator and not an automated trading system. It does not place trades, calculate position sizing, manage risk, predict future prices or guarantee profitable outcomes. BUY and SALE labels indicate that the indicator's analytical conditions for a regime transition have been satisfied according to its internal methodology. They should be considered alongside the user's own trading plan, market analysis and risk management process.
The indicator is intended for educational and analytical purposes and may be used on standard TradingView chart types supported by the platform. As with any analytical tool, market conditions can change rapidly, and no indicator should be relied upon as the sole basis for investment or trading decisions.
릴리즈 노트
The SBP Structured Scalping Indicator is an intraday market-analysis framework designed to identify transitions between bullish and bearish trading conditions. It combines developing session structure, volume participation, price response, directional pressure, momentum, volatility, and candle behaviour within one integrated calculation. Its purpose is to reduce isolated or repetitive signals by requiring agreement among several independent forms of market evidence.How the indicator works
The script creates an internal volume-by-price distribution for the developing trading session. Each candle’s volume is proportionally distributed across the price rows through which that candle traded. The calculation identifies the price row receiving the greatest estimated participation and then expands around that row until approximately 68% of the distributed session volume is covered.
This process produces three internal structural references:
• A control price representing the area of highest estimated participation.
• An upper core boundary.
• A lower core boundary.
These references are intentionally not plotted. They provide structural context for the signal engine while keeping the chart visually clean.
The indicator examines how price behaves around these developing areas. It identifies rejection from a core boundary, recovery or loss of the control price, acceptance beyond the participation core, liquidity sweeps of recent highs or lows, and initiative candles supported by relative volume.
Directional analysis
Market direction is evaluated using two price-response averages, an efficiency-responsive adaptive centre, ATR-normalised momentum, and signed volume pressure.
Signed volume pressure classifies volume according to whether a candle closes above or below its opening price and compares that pressure with average volume. The script evaluates both the current pressure balance and its rate of change. The adaptive centre changes its response according to the efficiency of price movement, becoming more responsive during directional movement and slower during irregular movement.
A bullish condition requires price direction, adaptive-centre position, pressure, momentum, structural location, and candle behaviour to provide sufficient positive evidence. Bearish conditions use the corresponding opposite requirements.
Signal construction
BUY and SALE signals are not generated from a single crossover or candle pattern. Every qualifying condition contributes to a weighted directional score. The calculation considers:
• Directional trend alignment.
• Signed volume-pressure balance.
• Improvement or deterioration in pressure.
• ATR-normalised momentum.
• Core-boundary rejection.
• Control-price recovery or failure.
• Recent high or low liquidity sweeps.
• Acceptance outside the participation core.
• Initiative candles supported by relative volume.
A signal is printed only when the relevant direction reaches its minimum evidence requirement, exceeds its score threshold, and leads the opposite directional score by a sufficient margin. Strong opposing trend, pressure, and momentum can block an otherwise qualifying signal.
The indicator uses fixed Balanced parameters internally. This provides moderate responsiveness while applying stronger confirmation than a highly aggressive scalping method. There is no automatic tuning or selectable trading-style mode.
Signal alternation
Signals follow a strict alternating sequence. After a BUY signal, another BUY cannot appear until a valid SALE signal has occurred. After a SALE signal, another SALE cannot appear until a valid BUY signal has occurred.
This state-based process prevents repeated same-direction labels during one continuing market phase. It does not impose an artificial minimum candle gap; the next signal depends on confirmed opposite evidence.
Adaptive Regime Guide
The Adaptive Regime Guide is the only plotted line. It combines the adaptive centre, current volatility, internal participation boundaries, control price, and the latest confirmed directional state.
Green represents a bullish regime and red represents a bearish regime. The guide is a directional reference, not an exact support, resistance, entry, stop-loss, or target level.
How to use it
Apply the indicator to a liquid intraday instrument and evaluate signals only after the candle closes. BUY and SALE alerts should be configured using “Once Per Bar Close.” Traders may use the guide to understand the active directional state and the labels as structured decision points requiring independent risk assessment.
Signals are confirmed-bar events and are not retrospectively shifted with an offset. However, the guide can move while the current candle is developing because it responds to live price and volume data.
Limitations
This indicator is not a trading strategy and does not provide position size, stop-loss, profit target, or performance guarantees. Volume quality varies between symbols and data providers. Developing session structure changes as new candles are completed. Market gaps, abnormal volatility, illiquid trading, and sudden news events can reduce effectiveness. Historical signals do not guarantee future results. Users should test the indicator on their intended symbol and timeframe and apply independent risk management before making trading decisions.
릴리즈 노트
SBP Structured Scalping IndicatorSBP Structured Scalping Indicator evaluates short-term price acceptance through two complementary signal paths: structure-based directional evidence and optional VWAP/RSI momentum events. Both paths feed one persistent Buy/Sale state. The purpose is to recognize either a qualifying response around developing value or a qualifying movement through session references, while presenting one consistent sequence of labels.
The indicator displays Buy and Sale labels and an optional Adaptive Regime Guide. Its internal profiles support calculations rather than visible histograms. It does not measure exchange order flow, identify institutional transactions or predict future turning points.
STRUCTURE AND VALUE CALCULATIONS
The structure path estimates a volume distribution over the developing daily calculation period, limited to the most recent 240 chart candles. It divides the observed range into 30 price rows and distributes each candle's reported volume according to its overlap with those rows.
The highest-volume row determines a volume-control reference. Contiguous expansion around that row determines an approximately 68% core value area. Price location relative to the control, core boundaries and core midpoint contributes to directional qualification. When the 240-candle limit is reached, this distribution becomes a rolling window within the calculation period.
This estimated distribution is calculated from candle OHLCV data. It is not exchange-provided volume-at-price, bid/ask delta or an order-book measurement. Symbols without reliable volume can produce less meaningful profile references.
STRUCTURE SIGNAL PATH
The structure engine evaluates five event types: rejection near a core boundary, reclaim of volume control, an excursion beyond a recent price extreme followed by a return, acceptance beyond core value, and directional initiative supported by relative volume and candle strength.
Trend context combines 9- and 24-period exponential averages with an efficiency-adaptive center. Pressure uses candle direction and volume relative to its smoothed average. Momentum measures smoothed price change relative to ATR. These are candle-derived estimates rather than measurements of actual buyer-initiated or seller-initiated trading.
A structure candidate requires an event trigger, at least four supporting evidence conditions, a directional score of at least 68, and an advantage of at least eight points over the opposing score. Strong opposing trend, pressure and momentum can veto that structure candidate. These scores are rule weights, not probabilities of a successful trade.
VWAP AND RSI SIGNAL PATH
The optional momentum path uses daily VWAP, its upper and lower one-standard-deviation bands, RSI and a separate developing outer distribution. Its profile resolution defaults to 24 rows, with chart or available lower-timeframe sampling options. Its outer boundaries use a 94% coverage target; discrete rows and the expansion rule can leave actual enclosed coverage below that target.
Before the first accepted momentum event of a daily period, a Buy requires a confirmed close above VWAP and both deviation bands, with RSI at or above its Buy threshold. A Sale requires the mirrored close below all three references with RSI at or below its Sale threshold. Defaults are RSI length 14, Buy threshold 60 and Sale threshold 45.
After an accepted momentum event, recovery and breakout conditions become available. Buy recovery requires price above the lower outer structure and lower deviation band; Buy breakout requires price above the upper outer structure and upper band. Sale conditions are mirrored. RSI qualification remains necessary. These later opportunities are detected when a condition becomes newly true, rather than repeatedly while it remains true.
The momentum path is restricted to standard intraday charts. It is an alternative entry path; it does not inherit the structure engine's score threshold or opposition veto.
SHARED LABELS AND GUIDE
Both paths share strict Buy/Sale alternation across daily boundaries. After Buy, another Buy is suppressed until Sale is accepted, and vice versa. Daily resets clear the momentum event-stage memory and rebuild daily references, but do not reset the shared direction.
Duplicate same-side candidates produce one label. If opposite candidates qualify before an initial direction is established, the conflict is suppressed. Once direction exists, only the opposite side is eligible. No daily signal cap, minimum candle separation or waiting period is imposed.
The Adaptive Regime Guide blends an efficiency-adaptive center, ATR allowance and developing core structure. Its direction and colour follow the accepted combined signal state. It is a contextual reference, not a guaranteed stop-loss level.
USE AND LIMITATIONS
Use the VWAP/RSI toggle to include or exclude the momentum path. Guide visibility and label visibility are independent display settings. Existing Buy, Sale and combined signal alerts are available.
Labels are accepted on confirmed candles with zero offset. Price feeds, lower-timeframe availability, profile sampling, loaded history and data revisions can affect results. Developing profile levels change during a session, and confirmation can delay signals. Detailed sampling can also increase calculation time. Review behaviour on the intended symbol and timeframe before use. This indicator is not a backtested strategy and makes no claim of verified accuracy, guaranteed returns or protection from losses.

S B Prasad Trading Ecosystem Email : sbptradingecosystem@gmail.com, Mobile and Whatsup No +919903367725 .
면책사항
해당 정보와 게시물은 금융, 투자, 트레이딩 또는 기타 유형의 조언이나 권장 사항으로 간주되지 않으며, 트레이딩뷰에서 제공하거나 보증하는 것이 아닙니다. 자세한 내용은 이용 약관을 참조하세요.
S B Prasad Trading Ecosystem Email : sbptradingecosystem@gmail.com, Mobile and Whatsup No +919903367725 .
면책사항
해당 정보와 게시물은 금융, 투자, 트레이딩 또는 기타 유형의 조언이나 권장 사항으로 간주되지 않으며, 트레이딩뷰에서 제공하거나 보증하는 것이 아닙니다. 자세한 내용은 이용 약관을 참조하세요.