OPEN-SOURCE SCRIPT
Extreme HMA ATR Bands
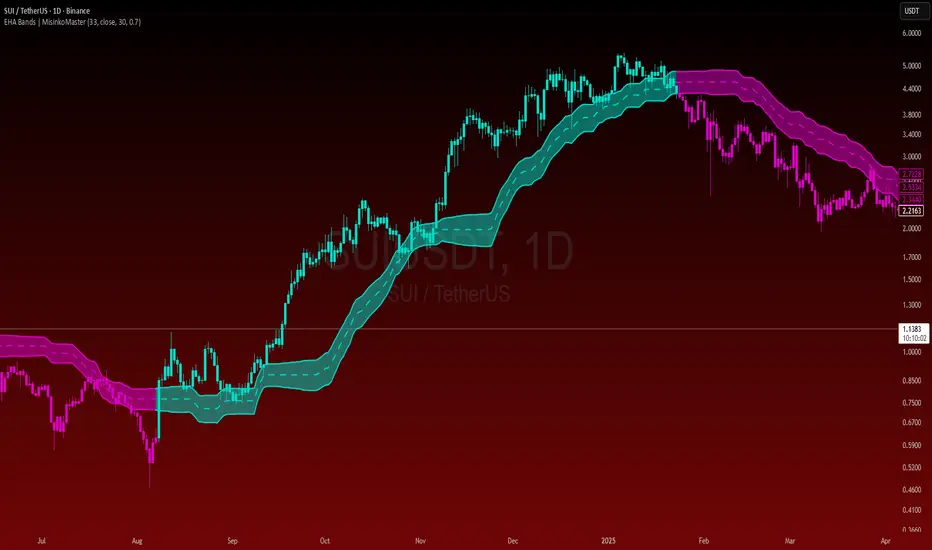
Extreme HMA ATR Bands
Extreme HMA ATR Bands are a fast and smooth trend-following tool designed to capture directional moves while minimizing false signals across volatile markets.
🚀 Benefits
• High responsiveness to market moves
• Smooth trend tracking with fewer false signals
• Strong performance on assets such as SOLUSD, SUIUSD, and CROUSD
• Clear visual band structure for easier market interpretation
💡 Core Idea
The indicator builds adaptive bands around a smoothed price structure derived from Hull-type processing. By focusing on extreme values and combining them into a balanced midpoint, the bands capture trend direction while maintaining smooth behavior.
ATR is then applied to dynamically scale the bands according to market volatility.
⚙️ How It Works
A fast-smoothed price series is calculated using Hull-style logic.
Highest and lowest values of this series are measured over multiple stages.
These extremes are processed again to balance responsiveness and smoothness.
The resulting midpoint forms the base trend line.
ATR is added and subtracted from this midpoint to generate adaptive upper and lower bands.
The result is a fast yet stable band structure that reacts efficiently to market direction changes.
📌 Usage Notes
• Price moving above the upper band suggests bullish pressure.
• Price moving below the lower band suggests bearish pressure.
• Band expansion signals increasing volatility.
• Band contraction often indicates consolidation phases.
Enjoy and trade smart.
Extreme HMA ATR Bands are a fast and smooth trend-following tool designed to capture directional moves while minimizing false signals across volatile markets.
🚀 Benefits
• High responsiveness to market moves
• Smooth trend tracking with fewer false signals
• Strong performance on assets such as SOLUSD, SUIUSD, and CROUSD
• Clear visual band structure for easier market interpretation
💡 Core Idea
The indicator builds adaptive bands around a smoothed price structure derived from Hull-type processing. By focusing on extreme values and combining them into a balanced midpoint, the bands capture trend direction while maintaining smooth behavior.
ATR is then applied to dynamically scale the bands according to market volatility.
⚙️ How It Works
A fast-smoothed price series is calculated using Hull-style logic.
Highest and lowest values of this series are measured over multiple stages.
These extremes are processed again to balance responsiveness and smoothness.
The resulting midpoint forms the base trend line.
ATR is added and subtracted from this midpoint to generate adaptive upper and lower bands.
The result is a fast yet stable band structure that reacts efficiently to market direction changes.
📌 Usage Notes
• Price moving above the upper band suggests bullish pressure.
• Price moving below the lower band suggests bearish pressure.
• Band expansion signals increasing volatility.
• Band contraction often indicates consolidation phases.
Enjoy and trade smart.
오픈 소스 스크립트
트레이딩뷰의 진정한 정신에 따라, 이 스크립트의 작성자는 이를 오픈소스로 공개하여 트레이더들이 기능을 검토하고 검증할 수 있도록 했습니다. 작성자에게 찬사를 보냅니다! 이 코드는 무료로 사용할 수 있지만, 코드를 재게시하는 경우 하우스 룰이 적용된다는 점을 기억하세요.

"Better to take a step back, than to stand stuck forever."
면책사항
해당 정보와 게시물은 금융, 투자, 트레이딩 또는 기타 유형의 조언이나 권장 사항으로 간주되지 않으며, 트레이딩뷰에서 제공하거나 보증하는 것이 아닙니다. 자세한 내용은 이용 약관을 참조하세요.
오픈 소스 스크립트
트레이딩뷰의 진정한 정신에 따라, 이 스크립트의 작성자는 이를 오픈소스로 공개하여 트레이더들이 기능을 검토하고 검증할 수 있도록 했습니다. 작성자에게 찬사를 보냅니다! 이 코드는 무료로 사용할 수 있지만, 코드를 재게시하는 경우 하우스 룰이 적용된다는 점을 기억하세요.
"Better to take a step back, than to stand stuck forever."
면책사항
해당 정보와 게시물은 금융, 투자, 트레이딩 또는 기타 유형의 조언이나 권장 사항으로 간주되지 않으며, 트레이딩뷰에서 제공하거나 보증하는 것이 아닙니다. 자세한 내용은 이용 약관을 참조하세요.