OPEN-SOURCE SCRIPT
RCA Relative Volume (RVol)
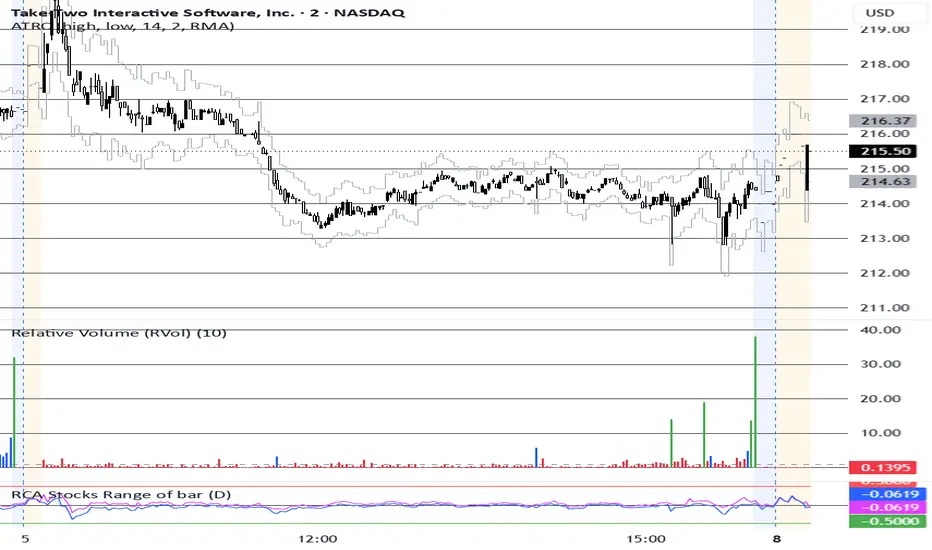
In the financial and trading markets, RVOL stands for Relative Volume. It is a technical indicator that compares the current trading volume of a stock (or other asset) to its average historical volume over a specified period (such as 10, 20, or 30 days). In this case, the average is calculated over the data of the same time of day (ex. 9:45 am current volume vs 10-day 9:45 am average volume).
The Formula= Current Volume/Volume.
RVOL of 1.0: The asset is trading at its exact average volume for that time of day.
RVOL above 2.0: The asset is "in play" and trading at twice its normal volume. This usually signals heightened market interest, increased liquidity, and the potential for large, volatile price movements.
RVOL below 1.0: The asset is experiencing lower-than-average market participation, typically resulting in a quieter, less volatile trading session.
The Formula= Current Volume/Volume.
RVOL of 1.0: The asset is trading at its exact average volume for that time of day.
RVOL above 2.0: The asset is "in play" and trading at twice its normal volume. This usually signals heightened market interest, increased liquidity, and the potential for large, volatile price movements.
RVOL below 1.0: The asset is experiencing lower-than-average market participation, typically resulting in a quieter, less volatile trading session.
오픈 소스 스크립트
트레이딩뷰의 진정한 정신에 따라, 이 스크립트의 작성자는 이를 오픈소스로 공개하여 트레이더들이 기능을 검토하고 검증할 수 있도록 했습니다. 작성자에게 찬사를 보냅니다! 이 코드는 무료로 사용할 수 있지만, 코드를 재게시하는 경우 하우스 룰이 적용된다는 점을 기억하세요.

면책사항
해당 정보와 게시물은 금융, 투자, 트레이딩 또는 기타 유형의 조언이나 권장 사항으로 간주되지 않으며, 트레이딩뷰에서 제공하거나 보증하는 것이 아닙니다. 자세한 내용은 이용 약관을 참조하세요.
오픈 소스 스크립트
트레이딩뷰의 진정한 정신에 따라, 이 스크립트의 작성자는 이를 오픈소스로 공개하여 트레이더들이 기능을 검토하고 검증할 수 있도록 했습니다. 작성자에게 찬사를 보냅니다! 이 코드는 무료로 사용할 수 있지만, 코드를 재게시하는 경우 하우스 룰이 적용된다는 점을 기억하세요.
면책사항
해당 정보와 게시물은 금융, 투자, 트레이딩 또는 기타 유형의 조언이나 권장 사항으로 간주되지 않으며, 트레이딩뷰에서 제공하거나 보증하는 것이 아닙니다. 자세한 내용은 이용 약관을 참조하세요.