업데이트됨
OCM Quarter Point Autopilot - A Multi-Timeframe Quarter Theory
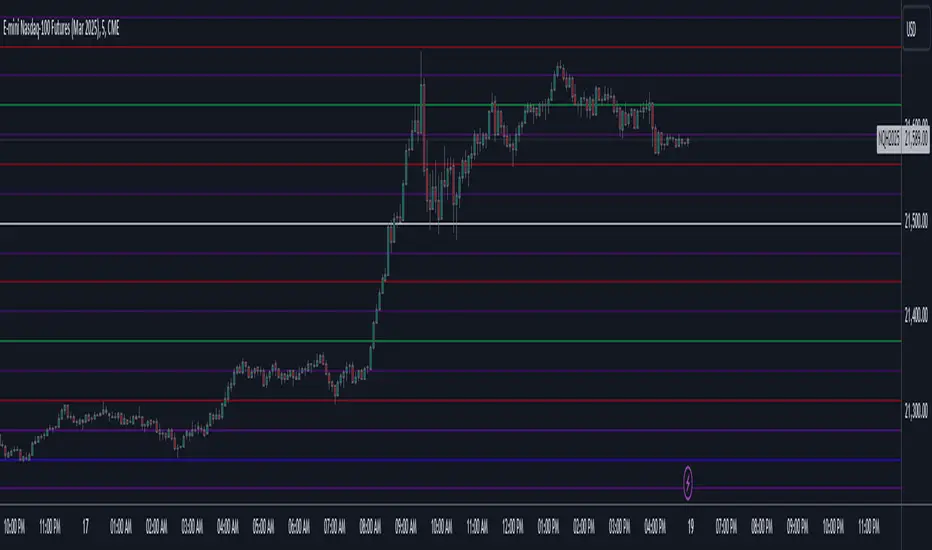
Description:
The OCM Quarter Point Autopilot indicator automates the application of Quarters Theory across multiple timeframes and instruments. It creates a comprehensive grid of support and resistance levels based on two user-defined price points (Monthly QTPs).
Key Features:
- Automatically calculates and displays quarter points across 5 timeframes:
• Monthly (Black lines)
• Weekly (Blue lines)
• Daily (Green lines)
• 4-Hour (Red lines)
• 1-Hour (Purple lines)
- Shows both upper and lower ranges, which can be toggled on/off
- Visual hierarchy through color-coding for easy timeframe identification
- Extends lines 2 years into the past and 6 months into the future
Usage:
1. Enter two Monthly Quarter Trading Points (QTPs)
2. The indicator automatically:
- Calculates midpoints (weekly)
- Quarter points (daily)
- Eighth points (4-hour)
- Further subdivisions (1-hour)
Benefits:
- Identifies potential support/resistance levels
- Helps spot key price targets
- Works on any instrument where psychological levels matter
- Provides multiple timeframe analysis in one view
Best suited for traders who:
- Follow multi-timeframe analysis
- Trade using support/resistance levels
- Want to identify potential price targets
- Need structured price levels for entries/exits
The indicator combines the systematic approach of Quarters Theory with automated calculation and visualization, making it easier to identify key price levels across multiple timeframes.
The OCM Quarter Point Autopilot indicator automates the application of Quarters Theory across multiple timeframes and instruments. It creates a comprehensive grid of support and resistance levels based on two user-defined price points (Monthly QTPs).
Key Features:
- Automatically calculates and displays quarter points across 5 timeframes:
• Monthly (Black lines)
• Weekly (Blue lines)
• Daily (Green lines)
• 4-Hour (Red lines)
• 1-Hour (Purple lines)
- Shows both upper and lower ranges, which can be toggled on/off
- Visual hierarchy through color-coding for easy timeframe identification
- Extends lines 2 years into the past and 6 months into the future
Usage:
1. Enter two Monthly Quarter Trading Points (QTPs)
2. The indicator automatically:
- Calculates midpoints (weekly)
- Quarter points (daily)
- Eighth points (4-hour)
- Further subdivisions (1-hour)
Benefits:
- Identifies potential support/resistance levels
- Helps spot key price targets
- Works on any instrument where psychological levels matter
- Provides multiple timeframe analysis in one view
Best suited for traders who:
- Follow multi-timeframe analysis
- Trade using support/resistance levels
- Want to identify potential price targets
- Need structured price levels for entries/exits
The indicator combines the systematic approach of Quarters Theory with automated calculation and visualization, making it easier to identify key price levels across multiple timeframes.
릴리즈 노트
Tweaks to underline script were done for the purpose of future iterations. :-) 릴리즈 노트
Simple Publication Fix 
면책사항
해당 정보와 게시물은 금융, 투자, 트레이딩 또는 기타 유형의 조언이나 권장 사항으로 간주되지 않으며, 트레이딩뷰에서 제공하거나 보증하는 것이 아닙니다. 자세한 내용은 이용 약관을 참조하세요.
면책사항
해당 정보와 게시물은 금융, 투자, 트레이딩 또는 기타 유형의 조언이나 권장 사항으로 간주되지 않으며, 트레이딩뷰에서 제공하거나 보증하는 것이 아닙니다. 자세한 내용은 이용 약관을 참조하세요.