OPEN-SOURCE SCRIPT
Advanced Support & Resistance - Volume Zones
**Advanced Support & Resistance - Volume Zones**
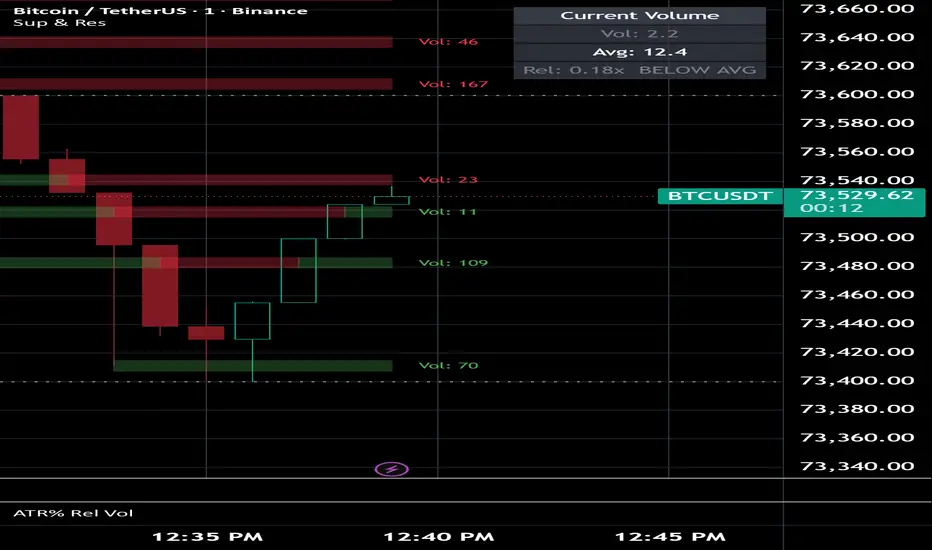
This indicator identifies potential support and resistance areas by detecting high-volume pivot points and converting them into visual price zones. Zones are created when unusual volume appears near local highs or lows, helping highlight areas where buying or selling pressure may have previously been significant.
The script includes automatic zone tuning that adjusts volume sensitivity, merge range, zone age, and visual zone thickness based on current market conditions and chart timeframe. This helps keep the zones proportional across very small timeframes, such as 1-second charts, as well as larger timeframes, including daily charts.
Key features include:
* High-volume support and resistance zone detection
* Automatic zone-setting adjustment based on market activity
* Automatic zone-appearance scaling by chart timeframe
* Optional volume-based zone widths
* Zone role reversal when price breaks through support or resistance
* Optional price-action swing lines for important pivot highs and lows that do not already have nearby volume zones
* Current bar volume status table showing volume, average volume, relative volume, and volume condition
* Customizable zone colors, opacity, borders, label size, and swing-line appearance
This script is designed to provide a cleaner view of meaningful support and resistance areas by combining volume activity with price structure. It can be useful for identifying possible reaction zones, breakout areas, retest levels, and areas of market interest.
As always, this indicator is intended as a visual analysis tool and should be used alongside your own trading plan, risk management, and confirmation methods.
Refinement assistance: Blue Finch
This indicator identifies potential support and resistance areas by detecting high-volume pivot points and converting them into visual price zones. Zones are created when unusual volume appears near local highs or lows, helping highlight areas where buying or selling pressure may have previously been significant.
The script includes automatic zone tuning that adjusts volume sensitivity, merge range, zone age, and visual zone thickness based on current market conditions and chart timeframe. This helps keep the zones proportional across very small timeframes, such as 1-second charts, as well as larger timeframes, including daily charts.
Key features include:
* High-volume support and resistance zone detection
* Automatic zone-setting adjustment based on market activity
* Automatic zone-appearance scaling by chart timeframe
* Optional volume-based zone widths
* Zone role reversal when price breaks through support or resistance
* Optional price-action swing lines for important pivot highs and lows that do not already have nearby volume zones
* Current bar volume status table showing volume, average volume, relative volume, and volume condition
* Customizable zone colors, opacity, borders, label size, and swing-line appearance
This script is designed to provide a cleaner view of meaningful support and resistance areas by combining volume activity with price structure. It can be useful for identifying possible reaction zones, breakout areas, retest levels, and areas of market interest.
As always, this indicator is intended as a visual analysis tool and should be used alongside your own trading plan, risk management, and confirmation methods.
Refinement assistance: Blue Finch
오픈 소스 스크립트
트레이딩뷰의 진정한 정신에 따라, 이 스크립트의 작성자는 이를 오픈소스로 공개하여 트레이더들이 기능을 검토하고 검증할 수 있도록 했습니다. 작성자에게 찬사를 보냅니다! 이 코드는 무료로 사용할 수 있지만, 코드를 재게시하는 경우 하우스 룰이 적용된다는 점을 기억하세요.

면책사항
해당 정보와 게시물은 금융, 투자, 트레이딩 또는 기타 유형의 조언이나 권장 사항으로 간주되지 않으며, 트레이딩뷰에서 제공하거나 보증하는 것이 아닙니다. 자세한 내용은 이용 약관을 참조하세요.
오픈 소스 스크립트
트레이딩뷰의 진정한 정신에 따라, 이 스크립트의 작성자는 이를 오픈소스로 공개하여 트레이더들이 기능을 검토하고 검증할 수 있도록 했습니다. 작성자에게 찬사를 보냅니다! 이 코드는 무료로 사용할 수 있지만, 코드를 재게시하는 경우 하우스 룰이 적용된다는 점을 기억하세요.
면책사항
해당 정보와 게시물은 금융, 투자, 트레이딩 또는 기타 유형의 조언이나 권장 사항으로 간주되지 않으며, 트레이딩뷰에서 제공하거나 보증하는 것이 아닙니다. 자세한 내용은 이용 약관을 참조하세요.