OPEN-SOURCE SCRIPT
Fibonacci Pivot Levels (KenshinC)
══════════════════════════════════════════════════════════════════════════════
FIBONACCI PIVOT LEVELS (KenshinC)
══════════════════════════════════════════════════════════════════════════════
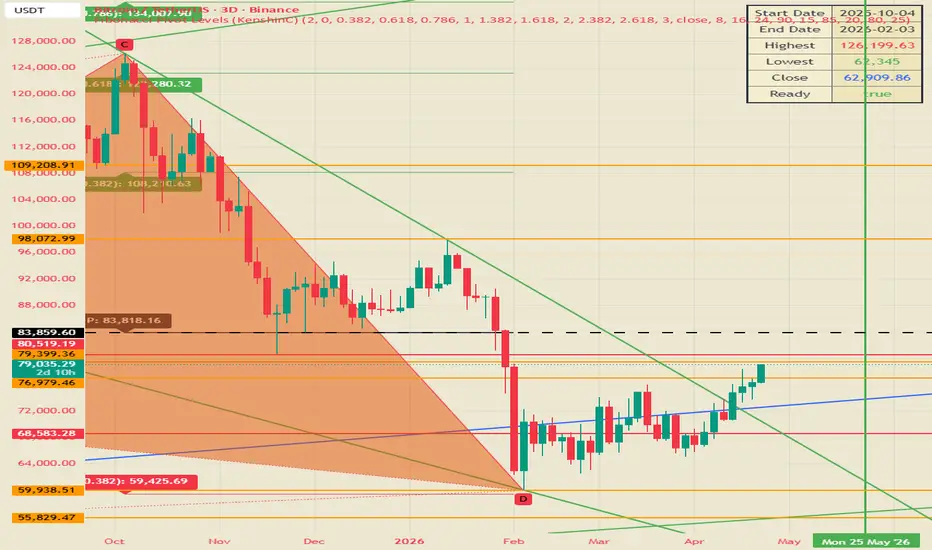
A powerful technical tool that merges classic Pivot Points with Fibonacci ratios
to reveal high-probability support and resistance zones.
By calculating the central Pivot Point (P) from the Highest, Lowest, and Close
prices over your selected period, the indicator automatically projects 10 custom
Fibonacci levels both above and below the pivot — creating clear, precise
horizontal levels that often act as strong price magnets.
Perfect for swing trading, day trading, breakout strategies, and spotting
potential reversals across Forex, Stocks, Crypto, and Commodities.
✨ Additional Feature:
Includes an advanced RSI Predictor that forecasts potential overbought and
oversold zones ahead of time, helping you anticipate momentum shifts.
══════════════════════════════════════════════════════════════════════════════
HOW TO USE
══════════════════════════════════════════════════════════════════════════════
1. Settings Overview
• Start Date & End Date : Choose the period to calculate High, Low & Close
• Use Close Value of End Date? : Use actual close or enter custom value
• Decimal Places : Display precision for price labels
• Fibonacci Rates (1–10) : Customize the 10 Fibonacci ratios
• Show RSI Calculations? : Enable/disable the RSI Predictor lines
2. Understanding the Levels
• P → Central Pivot Point (Black, bold line)
• S1–S10 → Support Levels (Red)
• R1–R10 → Resistance Levels (Green)
Formula:
Pivot (P) = (Highest + Lowest + Close) / 3
Support = P - (Fib Rate × Range)
Resistance = P + (Fib Rate × Range)
3. Information Table
Displays key data in the top-right corner:
- Start & End Date
- Highest & Lowest prices
- Close value used
- Data status
4. RSI Predictor
Plots forward-looking support & resistance based on RSI (length 8, 16, 24)
with customizable overbought/oversold thresholds.
══════════════════════════════════════════════════════════════════════════════
TRADING TIPS
══════════════════════════════════════════════════════════════════════════════
• Price above P → Generally bullish bias (focus on Support levels)
• Price below P → Generally bearish bias (focus on Resistance levels)
• Higher ratios (1.618, 2.000, 2.618, 3.000) often act as major turning zones
• Combine with candlestick patterns or volume for stronger confluences
══════════════════════════════════════════════════════════════════════════════
IMPORTANT DISCLAIMER
══════════════════════════════════════════════════════════════════════════════
This indicator is for educational and informational purposes only.
It is NOT financial advice, investment advice, or a recommendation to buy,
sell, or hold any securities or assets.
Trading involves substantial risk of loss and is not suitable for everyone.
Past performance does not guarantee future results.
Always conduct your own research and consult with a qualified financial advisor
before making any trading or investment decisions.
Use this tool at your own risk.
Created with passion by KenshinC
FIBONACCI PIVOT LEVELS (KenshinC)
══════════════════════════════════════════════════════════════════════════════
A powerful technical tool that merges classic Pivot Points with Fibonacci ratios
to reveal high-probability support and resistance zones.
By calculating the central Pivot Point (P) from the Highest, Lowest, and Close
prices over your selected period, the indicator automatically projects 10 custom
Fibonacci levels both above and below the pivot — creating clear, precise
horizontal levels that often act as strong price magnets.
Perfect for swing trading, day trading, breakout strategies, and spotting
potential reversals across Forex, Stocks, Crypto, and Commodities.
✨ Additional Feature:
Includes an advanced RSI Predictor that forecasts potential overbought and
oversold zones ahead of time, helping you anticipate momentum shifts.
══════════════════════════════════════════════════════════════════════════════
HOW TO USE
══════════════════════════════════════════════════════════════════════════════
1. Settings Overview
• Start Date & End Date : Choose the period to calculate High, Low & Close
• Use Close Value of End Date? : Use actual close or enter custom value
• Decimal Places : Display precision for price labels
• Fibonacci Rates (1–10) : Customize the 10 Fibonacci ratios
• Show RSI Calculations? : Enable/disable the RSI Predictor lines
2. Understanding the Levels
• P → Central Pivot Point (Black, bold line)
• S1–S10 → Support Levels (Red)
• R1–R10 → Resistance Levels (Green)
Formula:
Pivot (P) = (Highest + Lowest + Close) / 3
Support = P - (Fib Rate × Range)
Resistance = P + (Fib Rate × Range)
3. Information Table
Displays key data in the top-right corner:
- Start & End Date
- Highest & Lowest prices
- Close value used
- Data status
4. RSI Predictor
Plots forward-looking support & resistance based on RSI (length 8, 16, 24)
with customizable overbought/oversold thresholds.
══════════════════════════════════════════════════════════════════════════════
TRADING TIPS
══════════════════════════════════════════════════════════════════════════════
• Price above P → Generally bullish bias (focus on Support levels)
• Price below P → Generally bearish bias (focus on Resistance levels)
• Higher ratios (1.618, 2.000, 2.618, 3.000) often act as major turning zones
• Combine with candlestick patterns or volume for stronger confluences
══════════════════════════════════════════════════════════════════════════════
IMPORTANT DISCLAIMER
══════════════════════════════════════════════════════════════════════════════
This indicator is for educational and informational purposes only.
It is NOT financial advice, investment advice, or a recommendation to buy,
sell, or hold any securities or assets.
Trading involves substantial risk of loss and is not suitable for everyone.
Past performance does not guarantee future results.
Always conduct your own research and consult with a qualified financial advisor
before making any trading or investment decisions.
Use this tool at your own risk.
Created with passion by KenshinC
오픈 소스 스크립트
트레이딩뷰의 진정한 정신에 따라, 이 스크립트의 작성자는 이를 오픈소스로 공개하여 트레이더들이 기능을 검토하고 검증할 수 있도록 했습니다. 작성자에게 찬사를 보냅니다! 이 코드는 무료로 사용할 수 있지만, 코드를 재게시하는 경우 하우스 룰이 적용된다는 점을 기억하세요.

Made with passion by KenshinC
면책사항
해당 정보와 게시물은 금융, 투자, 트레이딩 또는 기타 유형의 조언이나 권장 사항으로 간주되지 않으며, 트레이딩뷰에서 제공하거나 보증하는 것이 아닙니다. 자세한 내용은 이용 약관을 참조하세요.
오픈 소스 스크립트
트레이딩뷰의 진정한 정신에 따라, 이 스크립트의 작성자는 이를 오픈소스로 공개하여 트레이더들이 기능을 검토하고 검증할 수 있도록 했습니다. 작성자에게 찬사를 보냅니다! 이 코드는 무료로 사용할 수 있지만, 코드를 재게시하는 경우 하우스 룰이 적용된다는 점을 기억하세요.
Made with passion by KenshinC
면책사항
해당 정보와 게시물은 금융, 투자, 트레이딩 또는 기타 유형의 조언이나 권장 사항으로 간주되지 않으며, 트레이딩뷰에서 제공하거나 보증하는 것이 아닙니다. 자세한 내용은 이용 약관을 참조하세요.