OPEN-SOURCE SCRIPT
VWAP Bands [DYNA]
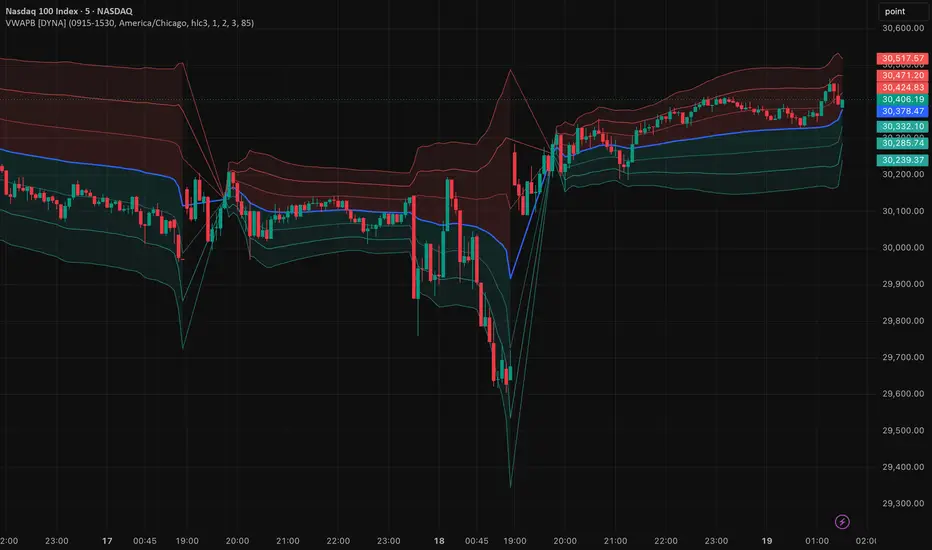
VWAP Bands plots a session-anchored Volume Weighted Average Price together with three pairs of standard-deviation bands at ±1σ, ±2σ, and ±3σ. VWAP is the session's dynamic fair value, and the bands are its statistical envelope: inside ±1σ is normal, beyond ±2σ is stretched, beyond ±3σ is extreme. The result is a single overlay that tells you where price sits relative to the day's mean and how volatile that session actually is.
Most VWAP indicators give you only the line. Most band indicators (Bollinger, Keltner) use a rolling window that carries yesterday's noise into today. VWAP Bands combines the two: volume-weighted anchoring plus intraday-only σ bands that widen and contract with the current session's realised volatility. At session open the bands reset to zero and fan out as the session develops.
Key Features
How It Works
At the start of each session -- determined by your session window and timezone -- the indicator begins accumulating the typical price weighted by volume: Σ(src × vol) divided by Σ(vol) gives the VWAP. In parallel it tracks Σ(src² × vol) to compute the volume-weighted variance, then the square root is the standard deviation. Bands are plotted at VWAP ± (multiplier × σ) for each of the three multipliers.
Because the sums are cumulative from session open, every bar updates VWAP and the bands. At the start of the session the bands collapse onto the VWAP line; as the session progresses they fan out and reflect the volatility the market is actually producing that day.
When the session ends and a new one begins, all accumulators reset. The lines are drawn only inside the configured session window -- no stale levels during off-hours.

VWAP (blue) with ±1σ, ±2σ, ±3σ bands (green below, red above) anchored to the session open. Bands fan out from VWAP as the session's realised volatility accumulates.
Settings
Session Time (default: 0915-1530) and Timezone (default: Asia/Kolkata) define the session window. VWAP Source (default: hlc3) sets the price used in the weighted average; hlc3 matches TradingView's built-in VWAP.
Band 1 / 2 / 3 Multiplier (defaults 1.0, 2.0, 3.0) set each band pair's offset in standard deviations. The defaults match the statistical convention -- ±1σ covers roughly 68% of in-session variation, ±2σ ~95%, ±3σ ~99.7% under a normal distribution. Adjust upward if the default envelopes feel too tight for your instrument.
Show VWAP Line and the three Show ±Nσ Bands toggles let you hide any line you do not want on the chart. Shade Between Bands enables gradient fills between adjacent bands; Fill Transparency (default: 85) controls how subtle those fills are.
The two alert toggles enable or disable the VWAP-cross and ±2σ-touch alerts independently.
Alerts
To set up alerts: click TradingView's Alerts button, choose "VWAP Bands [DYNA]" from the condition dropdown, pick one of the four alert variants, and select your notification channel.
Best Practices
Part of the DYNA Ecosystem
VWAP Bands is a free indicator built with the same design standards as the DYNA premium suite. For complete trade management with automatic stop loss, break-even, trailing stops, and multi-target systems, explore the full DYNA indicator collection.
Disclaimer
This indicator is a technical analysis and educational tool only -- it is not financial advice and makes no guarantee of any outcome. Past performance does not predict future results. Always do your own research and use proper position sizing and risk management.
Created by Varun Nidhi · varunnidhi.com
A free DYNA indicator — self-contained, no repainting.
Most VWAP indicators give you only the line. Most band indicators (Bollinger, Keltner) use a rolling window that carries yesterday's noise into today. VWAP Bands combines the two: volume-weighted anchoring plus intraday-only σ bands that widen and contract with the current session's realised volatility. At session open the bands reset to zero and fan out as the session develops.
Key Features
- Session-Anchored VWAP -- Uses the TradingView session picker plus a timezone dropdown so the same indicator works on any regional market without code edits.
- Three Band Pairs -- ±1σ, ±2σ, ±3σ with independently configurable multipliers. Each pair has its own visibility toggle.
- Adaptive Volatility Envelope -- Bands widen automatically when intraday volatility rises and compress on quiet sessions. No manual lookback window required.
- Gradient Band Shading -- Optional zone fills between adjacent bands, lighter toward the outer bands, so you can read where price is inside the envelope at a glance.
- Volume-Agnostic -- On instruments with no traded volume (some cash indices) the indicator falls back to a flat weight, so VWAP and bands still render meaningfully.
- Four Alerts -- Bullish VWAP cross, bearish VWAP cross, +2σ touch, -2σ touch. All confirmed on bar close.
- No Repainting -- Signal conditions are gated on confirmed bars; once an alert has fired, the historical signal does not move.
How It Works
At the start of each session -- determined by your session window and timezone -- the indicator begins accumulating the typical price weighted by volume: Σ(src × vol) divided by Σ(vol) gives the VWAP. In parallel it tracks Σ(src² × vol) to compute the volume-weighted variance, then the square root is the standard deviation. Bands are plotted at VWAP ± (multiplier × σ) for each of the three multipliers.
Because the sums are cumulative from session open, every bar updates VWAP and the bands. At the start of the session the bands collapse onto the VWAP line; as the session progresses they fan out and reflect the volatility the market is actually producing that day.
When the session ends and a new one begins, all accumulators reset. The lines are drawn only inside the configured session window -- no stale levels during off-hours.
VWAP (blue) with ±1σ, ±2σ, ±3σ bands (green below, red above) anchored to the session open. Bands fan out from VWAP as the session's realised volatility accumulates.
Settings
Session Time (default: 0915-1530) and Timezone (default: Asia/Kolkata) define the session window. VWAP Source (default: hlc3) sets the price used in the weighted average; hlc3 matches TradingView's built-in VWAP.
Band 1 / 2 / 3 Multiplier (defaults 1.0, 2.0, 3.0) set each band pair's offset in standard deviations. The defaults match the statistical convention -- ±1σ covers roughly 68% of in-session variation, ±2σ ~95%, ±3σ ~99.7% under a normal distribution. Adjust upward if the default envelopes feel too tight for your instrument.
Show VWAP Line and the three Show ±Nσ Bands toggles let you hide any line you do not want on the chart. Shade Between Bands enables gradient fills between adjacent bands; Fill Transparency (default: 85) controls how subtle those fills are.
The two alert toggles enable or disable the VWAP-cross and ±2σ-touch alerts independently.
Alerts
- Price Crosses Above VWAP -- Fires when close crosses above the VWAP line, signalling a session bias flip to bullish. "VWAP Bands [DYNA]: Price crossed above VWAP -- session bias flipping bullish."
- Price Crosses Below VWAP -- Fires when close crosses below the VWAP line. "VWAP Bands [DYNA]: Price crossed below VWAP -- session bias flipping bearish."
- Price Touches +2σ Band -- Fires when the bar high reaches the +2σ upper band, marking a stretched upside condition. "VWAP Bands [DYNA]: Price touched the +2σ upper band -- stretched above VWAP."
- Price Touches -2σ Band -- Fires when the bar low reaches the -2σ lower band, marking a stretched downside condition. "VWAP Bands [DYNA]: Price touched the -2σ lower band -- stretched below VWAP."
To set up alerts: click TradingView's Alerts button, choose "VWAP Bands [DYNA]" from the condition dropdown, pick one of the four alert variants, and select your notification channel.
Best Practices
- Give the bands 3-5 bars to stabilise at session open. Early-session standard deviation is tiny so the bands collapse onto VWAP; wait for the fan-out before reading them.
- Use ±2σ and ±3σ as mean-reversion zones. Touches of the outer bands under normal volatility often see a snap back toward VWAP, especially on higher timeframes.
- Use VWAP itself and ±1σ as pullback entry zones when price is trending cleanly on one side of VWAP.
- On volatile news sessions, bands expand rapidly -- a ±2σ touch there is much less extreme than a ±2σ touch on a quiet session. Let the band width itself inform how much weight to give each touch.
- On cash-index charts with no volume, treat the indicator as a session-anchored σ-band system rather than a true VWAP. The bands still reflect intraday dispersion meaningfully; the weighting just falls back to flat.
- Match Session Time to regular trading hours only -- including extended hours drags the VWAP and widens the bands unnecessarily.
Part of the DYNA Ecosystem
VWAP Bands is a free indicator built with the same design standards as the DYNA premium suite. For complete trade management with automatic stop loss, break-even, trailing stops, and multi-target systems, explore the full DYNA indicator collection.
Disclaimer
This indicator is a technical analysis and educational tool only -- it is not financial advice and makes no guarantee of any outcome. Past performance does not predict future results. Always do your own research and use proper position sizing and risk management.
Created by Varun Nidhi · varunnidhi.com
A free DYNA indicator — self-contained, no repainting.
오픈 소스 스크립트
트레이딩뷰의 진정한 정신에 따라, 이 스크립트의 작성자는 이를 오픈소스로 공개하여 트레이더들이 기능을 검토하고 검증할 수 있도록 했습니다. 작성자에게 찬사를 보냅니다! 이 코드는 무료로 사용할 수 있지만, 코드를 재게시하는 경우 하우스 룰이 적용된다는 점을 기억하세요.

면책사항
해당 정보와 게시물은 금융, 투자, 트레이딩 또는 기타 유형의 조언이나 권장 사항으로 간주되지 않으며, 트레이딩뷰에서 제공하거나 보증하는 것이 아닙니다. 자세한 내용은 이용 약관을 참조하세요.
오픈 소스 스크립트
트레이딩뷰의 진정한 정신에 따라, 이 스크립트의 작성자는 이를 오픈소스로 공개하여 트레이더들이 기능을 검토하고 검증할 수 있도록 했습니다. 작성자에게 찬사를 보냅니다! 이 코드는 무료로 사용할 수 있지만, 코드를 재게시하는 경우 하우스 룰이 적용된다는 점을 기억하세요.
면책사항
해당 정보와 게시물은 금융, 투자, 트레이딩 또는 기타 유형의 조언이나 권장 사항으로 간주되지 않으며, 트레이딩뷰에서 제공하거나 보증하는 것이 아닙니다. 자세한 내용은 이용 약관을 참조하세요.