OPEN-SOURCE SCRIPT
Temporal Bias Architect [JOAT]
Temporal Bias Architect [JOAT]
Introduction
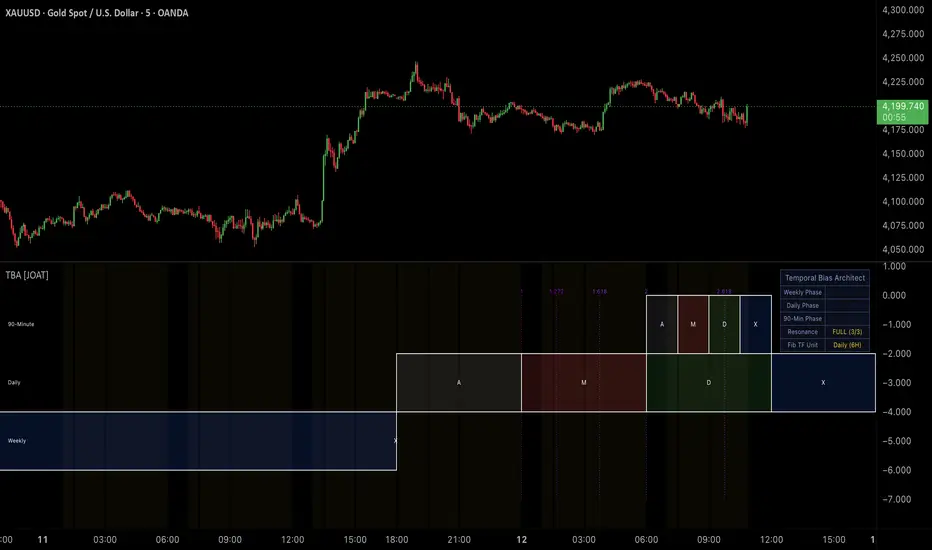
Temporal Bias Architect is an open-source time-structure indicator that maps price action onto three nested cycle frameworks simultaneously: weekly, daily, and 90-minute. Each framework divides its period into four sequential phases — Accumulation (A), Manipulation (M), Distribution (D), and Continuation/Reversal (X) — derived from Daye Quarterly Theory. These phases correspond to observable behavioral patterns at each time level: accumulation of position, engineered moves against the dominant bias, distribution of that position, and the resulting continuation or reversal.
The resonance score adds a second analytical layer: when all three timeframe levels are in the same phase simultaneously, the market context is most aligned and the behavioral pattern is most likely to produce a tradeable move.
Core Concepts
1. Quarterly Theory Phase Mapping
Each trading week is divided into four days (Monday through Thursday). Each trading day is divided into four six-hour blocks. Each six-hour block is divided into four 90-minute segments. The indicator assigns each division the same four-phase labels in order (A, M, D, X), creating a fractal structure where the same behavioral sequence repeats at every time scale.
The phase for each level is derived directly from time to ensure accuracy:
Pine Script®
Each phase is rendered as a color-coded box at its corresponding price row in the indicator pane.
2. Three-Row Visual Layout
The indicator displays three horizontal rows of phase boxes: Weekly (top), Daily (middle), and 90-Minute (bottom). Each row is independently togglable. The boxes are sized proportionally and colored using configurable per-phase colors. Phase labels (A, M, D, X) are centered within each box.

3. Resonance Scoring
When two or more timeframe levels are in the same phase simultaneously, the resonance score increments. Score of 3/3 means weekly, daily, and 90-minute phases all show the same letter — a maximum alignment event. The background shading activates at 3/3 alignment to flag the condition visually.
4. Fibonacci Time Zone Projection
From the start of each new trading day, the indicator projects Fibonacci time ratios (1.0, 1.272, 1.618, 2.0, 2.618) forward using a configurable time unit (90-minute, daily 6H block, or full day). These projections appear as vertical dotted lines with ratio labels. They mark the temporal points where price structure has historically been more likely to change character.
5. Historical Phase Visibility
A toggle controls whether prior days' boxes remain visible or are hidden as each new period begins. With history enabled, the full phase map is visible across the visible chart range, providing context for how phases have sequenced in the past.
Features
Input Parameters
General:
Quarterly Cycles:
Fibonacci Time Zones:
How to Use This Indicator
Step 1: Identify the Current Phase at Each Level
Check the dashboard rows for weekly, daily, and 90-minute phase. Each phase has a behavioral implication in Quarterly Theory: A = ranging accumulation, M = engineered spike against the prior move, D = directional distribution, X = reversal or continuation.
Step 2: Use the Resonance Score
A 3/3 resonance reading means all three time levels are in the same phase. The background shading triggers at this condition. Cross-timeframe alignment amplifies the behavioral tendency associated with that phase.
Step 3: Watch Fibonacci Time Projections
Fibonacci time ratios project when structural turning points may occur based on elapsed session time. Price approaching a projected Fib line while also in a key phase provides temporal context for setup timing.
Indicator Limitations
Originality Statement
The simultaneous three-level Quarterly Theory phase renderer with a resonance scoring system and Fibonacci time zone projection in a single Pine Script v6 publication is the original contribution. The resonance score — quantifying cross-timeframe phase alignment from 1 to 3 — adds an analytical layer not present in standalone ADMX or ICT quarterly theory tools.
Disclaimer
This indicator is provided for educational and informational purposes only. It is not financial advice. Quarterly Theory phase labels are observational frameworks and do not predict price direction. Trading involves substantial risk of loss.
-Made with passion by jackofalltrades
Introduction
Temporal Bias Architect is an open-source time-structure indicator that maps price action onto three nested cycle frameworks simultaneously: weekly, daily, and 90-minute. Each framework divides its period into four sequential phases — Accumulation (A), Manipulation (M), Distribution (D), and Continuation/Reversal (X) — derived from Daye Quarterly Theory. These phases correspond to observable behavioral patterns at each time level: accumulation of position, engineered moves against the dominant bias, distribution of that position, and the resulting continuation or reversal.
The resonance score adds a second analytical layer: when all three timeframe levels are in the same phase simultaneously, the market context is most aligned and the behavioral pattern is most likely to produce a tradeable move.
Core Concepts
1. Quarterly Theory Phase Mapping
Each trading week is divided into four days (Monday through Thursday). Each trading day is divided into four six-hour blocks. Each six-hour block is divided into four 90-minute segments. The indicator assigns each division the same four-phase labels in order (A, M, D, X), creating a fractal structure where the same behavioral sequence repeats at every time scale.
The phase for each level is derived directly from time to ensure accuracy:
Each phase is rendered as a color-coded box at its corresponding price row in the indicator pane.
2. Three-Row Visual Layout
The indicator displays three horizontal rows of phase boxes: Weekly (top), Daily (middle), and 90-Minute (bottom). Each row is independently togglable. The boxes are sized proportionally and colored using configurable per-phase colors. Phase labels (A, M, D, X) are centered within each box.
3. Resonance Scoring
When two or more timeframe levels are in the same phase simultaneously, the resonance score increments. Score of 3/3 means weekly, daily, and 90-minute phases all show the same letter — a maximum alignment event. The background shading activates at 3/3 alignment to flag the condition visually.
4. Fibonacci Time Zone Projection
From the start of each new trading day, the indicator projects Fibonacci time ratios (1.0, 1.272, 1.618, 2.0, 2.618) forward using a configurable time unit (90-minute, daily 6H block, or full day). These projections appear as vertical dotted lines with ratio labels. They mark the temporal points where price structure has historically been more likely to change character.
5. Historical Phase Visibility
A toggle controls whether prior days' boxes remain visible or are hidden as each new period begins. With history enabled, the full phase map is visible across the visible chart range, providing context for how phases have sequenced in the past.
Features
- Three-level phase mapping: Weekly, daily, and 90-minute Quarterly Theory phases displayed simultaneously
- Configurable phase colors: Accumulation, Manipulation, Distribution, and X colors independently adjustable
- Resonance score (1-3): Counts how many timeframe levels are in the same phase
- 3/3 alignment background: Gold background tint when all three levels align
- Fibonacci time zone projection: Five Fibonacci ratios projected forward from session open
- Configurable Fib time unit: 90-min, 6H, or daily unit for projection scaling
- Historical phase boxes: Toggle to show or hide prior periods' phase mapping
- Row labels: Left-edge labels identifying each horizontal row
- Dashboard: Current weekly, daily, and 90-min phase, resonance score, and Fib time unit
- Three alerts: Full resonance (3/3), new daily quarter, new weekly quarter
Input Parameters
General:
- Show Historical Quarters: Toggle past period box visibility (default: false)
- Auto-Detect Border Color: Adapts box border to chart background luminosity
Quarterly Cycles:
- Show Weekly / Daily / 90-Min toggles
- Show Phase Labels toggle
- Label Size: Tiny, Small, Normal, or Large
- Per-phase color inputs (A, M, D, X)
Fibonacci Time Zones:
- Show Fibonacci Time Zones toggle
- Fib Time Source: 0 = 90-min unit, 1 = daily 6H unit, 2 = weekly day unit
How to Use This Indicator
Step 1: Identify the Current Phase at Each Level
Check the dashboard rows for weekly, daily, and 90-minute phase. Each phase has a behavioral implication in Quarterly Theory: A = ranging accumulation, M = engineered spike against the prior move, D = directional distribution, X = reversal or continuation.
Step 2: Use the Resonance Score
A 3/3 resonance reading means all three time levels are in the same phase. The background shading triggers at this condition. Cross-timeframe alignment amplifies the behavioral tendency associated with that phase.
Step 3: Watch Fibonacci Time Projections
Fibonacci time ratios project when structural turning points may occur based on elapsed session time. Price approaching a projected Fib line while also in a key phase provides temporal context for setup timing.
Indicator Limitations
- Quarterly Theory describes observed behavioral tendencies, not mechanical guarantees — the same phase can produce different outcomes depending on higher-timeframe context
- Fibonacci time projections are probabilistic reference zones, not precise reversal targets
- The three-level phase structure works best on liquid instruments during regular trading hours; crypto markets with no session boundaries produce less distinct phase behavior
Originality Statement
The simultaneous three-level Quarterly Theory phase renderer with a resonance scoring system and Fibonacci time zone projection in a single Pine Script v6 publication is the original contribution. The resonance score — quantifying cross-timeframe phase alignment from 1 to 3 — adds an analytical layer not present in standalone ADMX or ICT quarterly theory tools.
Disclaimer
This indicator is provided for educational and informational purposes only. It is not financial advice. Quarterly Theory phase labels are observational frameworks and do not predict price direction. Trading involves substantial risk of loss.
-Made with passion by jackofalltrades
오픈 소스 스크립트
트레이딩뷰의 진정한 정신에 따라, 이 스크립트의 작성자는 이를 오픈소스로 공개하여 트레이더들이 기능을 검토하고 검증할 수 있도록 했습니다. 작성자에게 찬사를 보냅니다! 이 코드는 무료로 사용할 수 있지만, 코드를 재게시하는 경우 하우스 룰이 적용된다는 점을 기억하세요.

The Institutional Grade Trading Ecosystem, Built to win trades 📈
Get Access 👇
jackofalltrades.vip 🌐
t.me/jackofalltradesvip 🃏
Get Access 👇
jackofalltrades.vip 🌐
t.me/jackofalltradesvip 🃏
면책사항
해당 정보와 게시물은 금융, 투자, 트레이딩 또는 기타 유형의 조언이나 권장 사항으로 간주되지 않으며, 트레이딩뷰에서 제공하거나 보증하는 것이 아닙니다. 자세한 내용은 이용 약관을 참조하세요.
오픈 소스 스크립트
트레이딩뷰의 진정한 정신에 따라, 이 스크립트의 작성자는 이를 오픈소스로 공개하여 트레이더들이 기능을 검토하고 검증할 수 있도록 했습니다. 작성자에게 찬사를 보냅니다! 이 코드는 무료로 사용할 수 있지만, 코드를 재게시하는 경우 하우스 룰이 적용된다는 점을 기억하세요.
The Institutional Grade Trading Ecosystem, Built to win trades 📈
Get Access 👇
jackofalltrades.vip 🌐
t.me/jackofalltradesvip 🃏
Get Access 👇
jackofalltrades.vip 🌐
t.me/jackofalltradesvip 🃏
면책사항
해당 정보와 게시물은 금융, 투자, 트레이딩 또는 기타 유형의 조언이나 권장 사항으로 간주되지 않으며, 트레이딩뷰에서 제공하거나 보증하는 것이 아닙니다. 자세한 내용은 이용 약관을 참조하세요.