OPEN-SOURCE SCRIPT
Minervini Must Conditions
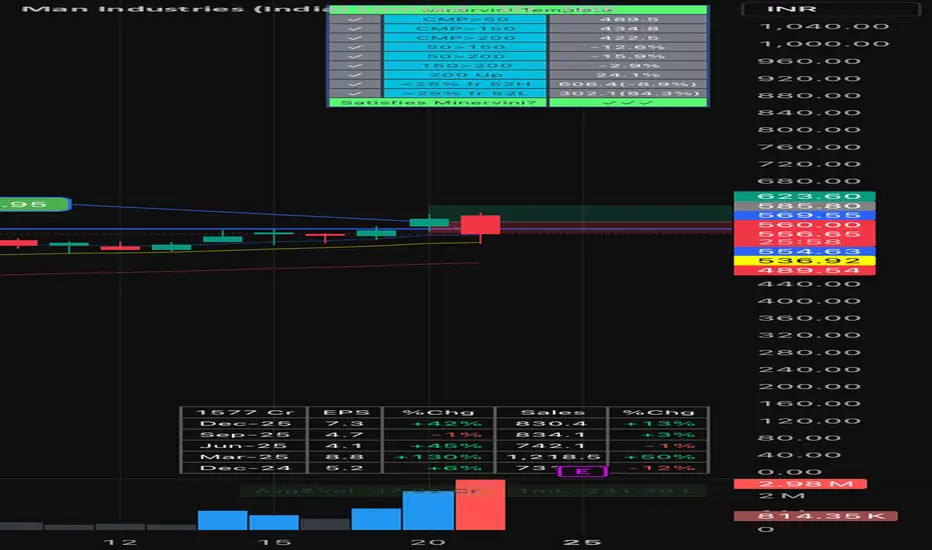
Here's the full description:
Mark Minervini's Trend Template Screener
⚠️ Disclaimer: This indicator is for educational and informational purposes only. It is NOT a buy, sell, or hold recommendation. Always do your own research and consult a SEBI-registered financial advisor before making any investment decisions. Past performance does not guarantee future results.
What is this?
This indicator automates Mark Minervini's famous Trend Template — a checklist he uses to identify stocks in a confirmed Stage 2 uptrend before they make big moves. Minervini is a U.S. Stock Champion (1997) and author of Trade Like a Stock Market Wizard.
The 9 Conditions & Why They Matter:
CMP > 50 MA — Price is above its short-term average. This confirms immediate bullish momentum. If price can't hold above 50 MA, short-term sellers are in control.
CMP > 150 MA — Price is above intermediate trend. This filters out stocks that may have bounced short-term but are still in a broader downtrend.
CMP > 200 MA — Price is above the long-term average. Institutional investors watch 200 MA closely. Trading above it signals big money is supportive.
50 MA > 150 MA — Short-term trend is stronger than intermediate. This means recent buying pressure is accelerating, not fading.
50 MA > 200 MA — Short-term trend leads long-term. Confirms the stock isn't just surviving — it's outperforming its own history.
150 MA > 200 MA — Intermediate trend leads long-term. This is the structural backbone. When this flips bullish, it signals a genuine trend shift, not just a bounce.
200 MA trending up (1 month) — The slowest moving average is rising. This is the hardest condition to fake. A rising 200 MA means sustained accumulation over months.
Within 25% of 52-week high — Stock is near its highs. Minervini avoids "fallen angels" trading far from highs. Stocks near highs have less overhead resistance (trapped sellers) and more momentum.
>25% above 52-week low — Stock has moved significantly off its lows. This eliminates bottom-fishers and ensures the stock has already proven buyer interest with a strong base breakout.
Why all 9 together?
Any single condition can give false signals. A stock above 50 MA might still be in a long-term downtrend. A stock near 52-week highs might have collapsing moving averages. Minervini's genius is stacking all 9 — when every condition aligns, you're looking at a stock where short-term, intermediate, and long-term trends are all bullish, momentum is accelerating, and the price structure confirms institutional accumulation. This drastically reduces the universe of stocks to only the strongest candidates.
How to use:
✓ = condition passed, ✗ = condition failed
All 9 must show ✓ for a stock to qualify
Supports EMA/SMA toggle
Daily timeframe only
Table size and position adjustable
This is a screening tool, not a trading signal. Use it to build your watchlist, then apply your own entry/exit strategy, risk management, and position sizing.
© financetalkswithaman
Mark Minervini's Trend Template Screener
⚠️ Disclaimer: This indicator is for educational and informational purposes only. It is NOT a buy, sell, or hold recommendation. Always do your own research and consult a SEBI-registered financial advisor before making any investment decisions. Past performance does not guarantee future results.
What is this?
This indicator automates Mark Minervini's famous Trend Template — a checklist he uses to identify stocks in a confirmed Stage 2 uptrend before they make big moves. Minervini is a U.S. Stock Champion (1997) and author of Trade Like a Stock Market Wizard.
The 9 Conditions & Why They Matter:
CMP > 50 MA — Price is above its short-term average. This confirms immediate bullish momentum. If price can't hold above 50 MA, short-term sellers are in control.
CMP > 150 MA — Price is above intermediate trend. This filters out stocks that may have bounced short-term but are still in a broader downtrend.
CMP > 200 MA — Price is above the long-term average. Institutional investors watch 200 MA closely. Trading above it signals big money is supportive.
50 MA > 150 MA — Short-term trend is stronger than intermediate. This means recent buying pressure is accelerating, not fading.
50 MA > 200 MA — Short-term trend leads long-term. Confirms the stock isn't just surviving — it's outperforming its own history.
150 MA > 200 MA — Intermediate trend leads long-term. This is the structural backbone. When this flips bullish, it signals a genuine trend shift, not just a bounce.
200 MA trending up (1 month) — The slowest moving average is rising. This is the hardest condition to fake. A rising 200 MA means sustained accumulation over months.
Within 25% of 52-week high — Stock is near its highs. Minervini avoids "fallen angels" trading far from highs. Stocks near highs have less overhead resistance (trapped sellers) and more momentum.
>25% above 52-week low — Stock has moved significantly off its lows. This eliminates bottom-fishers and ensures the stock has already proven buyer interest with a strong base breakout.
Why all 9 together?
Any single condition can give false signals. A stock above 50 MA might still be in a long-term downtrend. A stock near 52-week highs might have collapsing moving averages. Minervini's genius is stacking all 9 — when every condition aligns, you're looking at a stock where short-term, intermediate, and long-term trends are all bullish, momentum is accelerating, and the price structure confirms institutional accumulation. This drastically reduces the universe of stocks to only the strongest candidates.
How to use:
✓ = condition passed, ✗ = condition failed
All 9 must show ✓ for a stock to qualify
Supports EMA/SMA toggle
Daily timeframe only
Table size and position adjustable
This is a screening tool, not a trading signal. Use it to build your watchlist, then apply your own entry/exit strategy, risk management, and position sizing.
© financetalkswithaman
오픈 소스 스크립트
트레이딩뷰의 진정한 정신에 따라, 이 스크립트의 작성자는 이를 오픈소스로 공개하여 트레이더들이 기능을 검토하고 검증할 수 있도록 했습니다. 작성자에게 찬사를 보냅니다! 이 코드는 무료로 사용할 수 있지만, 코드를 재게시하는 경우 하우스 룰이 적용된다는 점을 기억하세요.

면책사항
해당 정보와 게시물은 금융, 투자, 트레이딩 또는 기타 유형의 조언이나 권장 사항으로 간주되지 않으며, 트레이딩뷰에서 제공하거나 보증하는 것이 아닙니다. 자세한 내용은 이용 약관을 참조하세요.
오픈 소스 스크립트
트레이딩뷰의 진정한 정신에 따라, 이 스크립트의 작성자는 이를 오픈소스로 공개하여 트레이더들이 기능을 검토하고 검증할 수 있도록 했습니다. 작성자에게 찬사를 보냅니다! 이 코드는 무료로 사용할 수 있지만, 코드를 재게시하는 경우 하우스 룰이 적용된다는 점을 기억하세요.
면책사항
해당 정보와 게시물은 금융, 투자, 트레이딩 또는 기타 유형의 조언이나 권장 사항으로 간주되지 않으며, 트레이딩뷰에서 제공하거나 보증하는 것이 아닙니다. 자세한 내용은 이용 약관을 참조하세요.