OPEN-SOURCE SCRIPT
Futrues Daily Pivot Zones
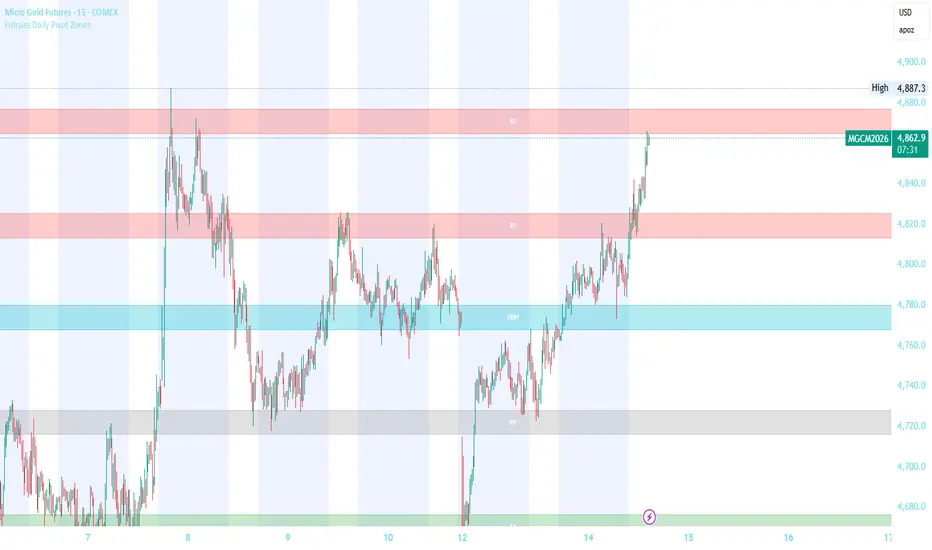
Automatically plots Daily Pivot Point levels as clean rectangle zones directly on your futures chart. Levels are calculated from the previous day's High, Low, and Close — the same levels watched by institutions, banks, and algorithms every single session.
Levels Included:
PP — Main Pivot Point (most watched level of the day)
R1, R2, R3 — Resistance zones above PP
S1, S2, S3 — Support zones below PP
PDH — Previous Day High
PDL — Previous Day Low
How To Use:
Look for price to reject or bounce off a zone in confluence with your EMA bias and VWAP direction. The more factors that agree at a zone — the stronger the trade.
Recommended Zone Buffer By Instrument:
MES (Micro E-Mini S&P 500) → 4.0 - 5.0 points
MNQ (Micro E-Mini Nasdaq) → 8.0 - 10.0 points
MGC (Micro Gold) → 15.0 - 20.0 points
MCL (Micro Crude Oil) → 0.15 - 0.25 points
M2K (Micro Russell 2000) → 3.0 - 4.0 points
Recommended Lookback:
750 bars on a 15-min chart covers approximately 3 trading days of price action.
Levels Included:
PP — Main Pivot Point (most watched level of the day)
R1, R2, R3 — Resistance zones above PP
S1, S2, S3 — Support zones below PP
PDH — Previous Day High
PDL — Previous Day Low
How To Use:
Look for price to reject or bounce off a zone in confluence with your EMA bias and VWAP direction. The more factors that agree at a zone — the stronger the trade.
Recommended Zone Buffer By Instrument:
MES (Micro E-Mini S&P 500) → 4.0 - 5.0 points
MNQ (Micro E-Mini Nasdaq) → 8.0 - 10.0 points
MGC (Micro Gold) → 15.0 - 20.0 points
MCL (Micro Crude Oil) → 0.15 - 0.25 points
M2K (Micro Russell 2000) → 3.0 - 4.0 points
Recommended Lookback:
750 bars on a 15-min chart covers approximately 3 trading days of price action.
오픈 소스 스크립트
트레이딩뷰의 진정한 정신에 따라, 이 스크립트의 작성자는 이를 오픈소스로 공개하여 트레이더들이 기능을 검토하고 검증할 수 있도록 했습니다. 작성자에게 찬사를 보냅니다! 이 코드는 무료로 사용할 수 있지만, 코드를 재게시하는 경우 하우스 룰이 적용된다는 점을 기억하세요.

면책사항
해당 정보와 게시물은 금융, 투자, 트레이딩 또는 기타 유형의 조언이나 권장 사항으로 간주되지 않으며, 트레이딩뷰에서 제공하거나 보증하는 것이 아닙니다. 자세한 내용은 이용 약관을 참조하세요.
오픈 소스 스크립트
트레이딩뷰의 진정한 정신에 따라, 이 스크립트의 작성자는 이를 오픈소스로 공개하여 트레이더들이 기능을 검토하고 검증할 수 있도록 했습니다. 작성자에게 찬사를 보냅니다! 이 코드는 무료로 사용할 수 있지만, 코드를 재게시하는 경우 하우스 룰이 적용된다는 점을 기억하세요.
면책사항
해당 정보와 게시물은 금융, 투자, 트레이딩 또는 기타 유형의 조언이나 권장 사항으로 간주되지 않으며, 트레이딩뷰에서 제공하거나 보증하는 것이 아닙니다. 자세한 내용은 이용 약관을 참조하세요.