OPEN-SOURCE SCRIPT
KOCA IB STATS
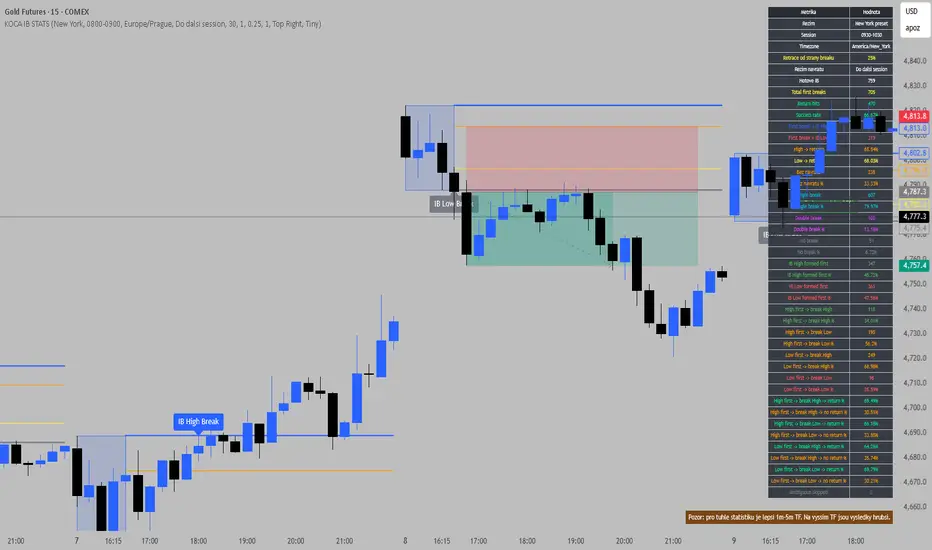
IB Statistics - Overlay
Advanced statistical indicator for Initial Balance (IB), focused on analyzing what price does after the IB is formed during London or New York sessions, or any custom session.
This is not just a visual IB tool — it’s a data-driven edge finder.
What this indicator does:
Draws IB High and IB Low
Displays IB box with customizable colors
Plots dynamic retrace levels based on selected percentage
Detects first break (IB High / IB Low)
Tracks whether price returns to the selected retrace level
Supports return windows:
Minutes
Hours
Until next session
Classifies daily behavior:
Single break
Double break
No break
No return
Tracks which side of IB was formed first (High or Low)
Provides conditional statistics such as:
High formed first → what breaks first
Low formed first → what breaks first
Measures continuation vs retrace probabilities after specific setups
Key insight this tool provides:
This indicator connects multiple layers of context:
How IB was formed
Which side breaks first
Whether price retraces or continues
Instead of guessing, you get real statistical probabilities for:
continuation trades
fade setups
IB-based strategies
Session modes:
London (preset)
New York (preset)
Custom session
Presets use correct timezones:
Europe/London
America/New_York
This means DST (summer/winter time shifts are handled correctly) — no manual adjustments needed.
Best usage:
For accurate results, use on lower timeframes:
1m
3m
5m
Higher timeframes will produce less precise statistics due to candle aggregation.
Who is this for:
Traders who want to move beyond visual IB trading and actually understand:
what happens after a breakout
when continuation is more likely
when retrace setups have higher probability
Core idea:
This indicator answers questions like:
If IB High forms first, what is more likely to break?
After a High break, does price usually continue or retrace?
How often does price fail to return?
What percentage of days produce clean vs messy behavior?
Short description (for quick publish):
Advanced Initial Balance (IB) statistical tool. Tracks IB formation, first break behavior, retrace probabilities, and continuation patterns across London, New York, or custom sessions. Designed to turn IB trading into a data-driven strategy. Best used on 1m–5m timeframe.
Advanced statistical indicator for Initial Balance (IB), focused on analyzing what price does after the IB is formed during London or New York sessions, or any custom session.
This is not just a visual IB tool — it’s a data-driven edge finder.
What this indicator does:
Draws IB High and IB Low
Displays IB box with customizable colors
Plots dynamic retrace levels based on selected percentage
Detects first break (IB High / IB Low)
Tracks whether price returns to the selected retrace level
Supports return windows:
Minutes
Hours
Until next session
Classifies daily behavior:
Single break
Double break
No break
No return
Tracks which side of IB was formed first (High or Low)
Provides conditional statistics such as:
High formed first → what breaks first
Low formed first → what breaks first
Measures continuation vs retrace probabilities after specific setups
Key insight this tool provides:
This indicator connects multiple layers of context:
How IB was formed
Which side breaks first
Whether price retraces or continues
Instead of guessing, you get real statistical probabilities for:
continuation trades
fade setups
IB-based strategies
Session modes:
London (preset)
New York (preset)
Custom session
Presets use correct timezones:
Europe/London
America/New_York
This means DST (summer/winter time shifts are handled correctly) — no manual adjustments needed.
Best usage:
For accurate results, use on lower timeframes:
1m
3m
5m
Higher timeframes will produce less precise statistics due to candle aggregation.
Who is this for:
Traders who want to move beyond visual IB trading and actually understand:
what happens after a breakout
when continuation is more likely
when retrace setups have higher probability
Core idea:
This indicator answers questions like:
If IB High forms first, what is more likely to break?
After a High break, does price usually continue or retrace?
How often does price fail to return?
What percentage of days produce clean vs messy behavior?
Short description (for quick publish):
Advanced Initial Balance (IB) statistical tool. Tracks IB formation, first break behavior, retrace probabilities, and continuation patterns across London, New York, or custom sessions. Designed to turn IB trading into a data-driven strategy. Best used on 1m–5m timeframe.
오픈 소스 스크립트
트레이딩뷰의 진정한 정신에 따라, 이 스크립트의 작성자는 이를 오픈소스로 공개하여 트레이더들이 기능을 검토하고 검증할 수 있도록 했습니다. 작성자에게 찬사를 보냅니다! 이 코드는 무료로 사용할 수 있지만, 코드를 재게시하는 경우 하우스 룰이 적용된다는 점을 기억하세요.

면책사항
해당 정보와 게시물은 금융, 투자, 트레이딩 또는 기타 유형의 조언이나 권장 사항으로 간주되지 않으며, 트레이딩뷰에서 제공하거나 보증하는 것이 아닙니다. 자세한 내용은 이용 약관을 참조하세요.
오픈 소스 스크립트
트레이딩뷰의 진정한 정신에 따라, 이 스크립트의 작성자는 이를 오픈소스로 공개하여 트레이더들이 기능을 검토하고 검증할 수 있도록 했습니다. 작성자에게 찬사를 보냅니다! 이 코드는 무료로 사용할 수 있지만, 코드를 재게시하는 경우 하우스 룰이 적용된다는 점을 기억하세요.
면책사항
해당 정보와 게시물은 금융, 투자, 트레이딩 또는 기타 유형의 조언이나 권장 사항으로 간주되지 않으며, 트레이딩뷰에서 제공하거나 보증하는 것이 아닙니다. 자세한 내용은 이용 약관을 참조하세요.