Heartland Previous-Day Pivot Levels
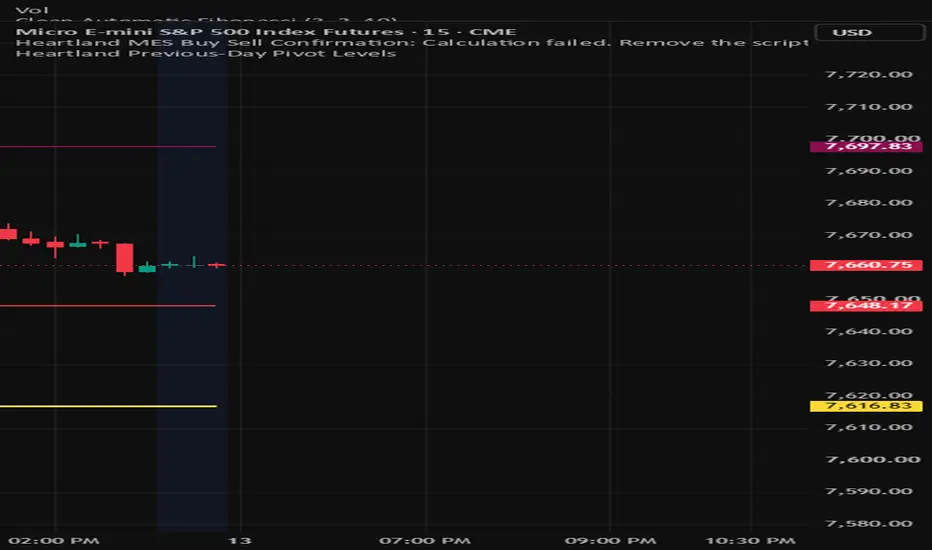
This indicator calculates traditional pivot levels using the previous completed trading day’s high, low and closing price. It displays the central equilibrium pivot, R1 and R2 resistance levels, and S1 and S2 support levels. The levels update automatically at the beginning of each new trading day and can help traders identify market direction, potential support and resistance, and possible profit targets. This indicator is intended for educational and market-analysis purposes only and should not be considered financial advice.

면책사항
해당 정보와 게시물은 금융, 투자, 트레이딩 또는 기타 유형의 조언이나 권장 사항으로 간주되지 않으며, 트레이딩뷰에서 제공하거나 보증하는 것이 아닙니다. 자세한 내용은 이용 약관을 참조하세요.
면책사항
해당 정보와 게시물은 금융, 투자, 트레이딩 또는 기타 유형의 조언이나 권장 사항으로 간주되지 않으며, 트레이딩뷰에서 제공하거나 보증하는 것이 아닙니다. 자세한 내용은 이용 약관을 참조하세요.