Kaufman Adaptive Band-Channel Trend [SchizoQuant]
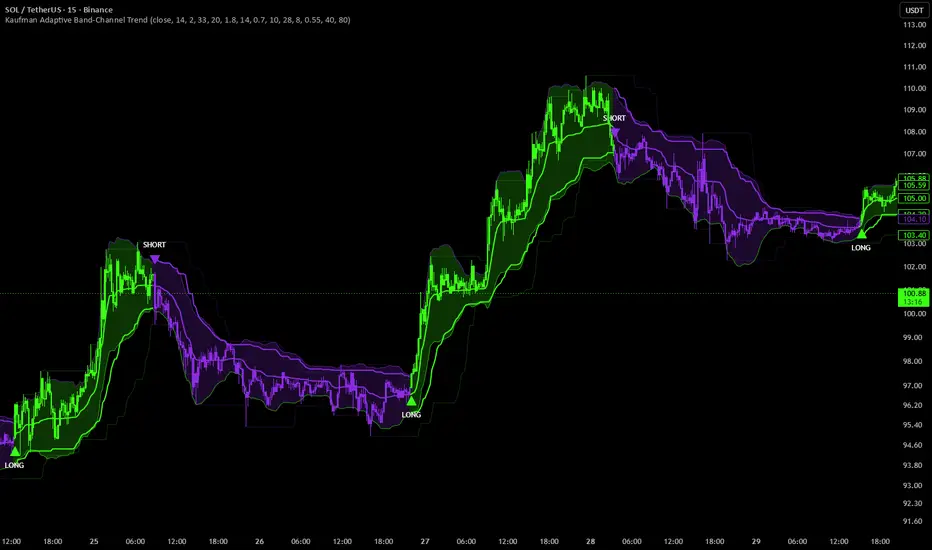
🟣Kaufman Adaptive Band-Channel Trend is an adaptive trend-following indicator that combines Kaufman's Adaptive Moving Average (KAMA), RMS volatility bands, Donchian price channels, and directional persistence to identify bullish and bearish market regimes.
Instead of relying on a fixed moving-average crossover, the indicator builds a structural trend defense that adjusts to market efficiency, volatility, and price behavior. This allows directional trends to maintain their established state through ordinary fluctuations while responding to confirmed breaches of the active defense.
🟣How It Works
🟣Adaptive Band-Channel Mechanism
🟣Signal Logic
🟣Visual Feedback
🟣User Controls
🟣What Makes It Different
🟣Intended Use
🟣Limitations
Instead of relying on a fixed moving-average crossover, the indicator builds a structural trend defense that adjusts to market efficiency, volatility, and price behavior. This allows directional trends to maintain their established state through ordinary fluctuations while responding to confirmed breaches of the active defense.
🟣How It Works
The indicator begins by measuring Kaufman's Efficiency Ratio, which compares net directional price movement with total price movement over a selected period.
Higher efficiency increases KAMA's responsiveness, while inefficient price movement produces stronger smoothing.Pine Script®
The resulting adaptive average provides the central reference for evaluating directional price movement and trend stability.
🟣Adaptive Band-Channel Mechanism
An RMS volatility envelope measures price displacement around KAMA, while an ATR-based floor prevents the bands from becoming excessively narrow.
The indicator also calculates fast and slow Donchian channels using previously completed candles.
Directional residence measures how consistently price closes above or below KAMA. Combined with market efficiency, this determines the influence of longer-term Donchian structure.Pine Script®
This produces adaptive boundaries that combine volatility-based price tracking with historical support and resistance, rather than depending exclusively on either method.
🟣Signal Logic
The indicator maintains a persistent bullish or bearish regime through its internal trend state.
- LONG: A confirmed candle closes above the active bearish trend defense.
- SHORT: A confirmed candle closes below the active bullish trend defense.
During an established bullish regime, the defense can advance upward but cannot move downward. During a bearish regime, it can move downward but cannot move upward.
The relevant reversal logic is:Pine Script®
The bearish regime uses the corresponding opposite conditions.
Signals are evaluated on confirmed candle closes. Initial trend initialization does not generate a LONG or SHORT marker.
🟣Visual Feedback
- Neon green: Bullish trend regime and bullish defense.
- Purple: Bearish trend regime and bearish defense.
- Kaufman Adaptive Average: Efficiency-adjusted trend center.
- Adaptive RMS bands: Volatility envelope surrounding KAMA.
- Donchian channel: Completed historical price boundaries.
- Trend defense: Persistent reversal boundary for the active regime.
- LONG / SHORT triangles: Confirmed regime transitions.
- Candle coloring: Visual identification of prevailing trend direction.
Band-line and band-fill transparency can be adjusted independently without affecting calculations or signals.
🟣User Controls
Users can customize KAMA efficiency and smoothing lengths, RMS band settings, ATR floor, Donchian channel periods, directional residence, and structural influence.
Visualization settings allow independent control over the adaptive average, bands, Donchian channel, trend defense, signal markers, and candle coloring.
Bullish and bearish colors are customizable.
🟣What Makes It Different
The indicator integrates three complementary components: KAMA for adaptive smoothing, RMS and ATR for volatility measurement, and Donchian channels for structural price boundaries.
Market efficiency influences both the moving-average response and the relative importance of price structure. Directional residence further adjusts how much the longer-term channel contributes to trend defense.
This creates a persistent regime model with a trailing boundary that responds to changing market conditions.
🟣Intended Use
Kaufman Adaptive Band-Channel Trend is designed for trend identification, monitoring directional persistence, evaluating structural support and resistance, and detecting confirmed transitions between bullish and bearish market regimes.
It can serve as a visual trend reference or as a directional filter within a broader trading methodology.
🟣Limitations
The indicator is reactive rather than predictive. Choppy markets may cause repeated regime changes, while stronger smoothing or wider adaptive boundaries can delay reversals.
The trend defense is a calculated reference, not a guaranteed support, resistance, or stop-loss execution level. Performance depends on market conditions, timeframe, and parameter selection.

🟣 Profitable Crypto Strategies | Free Trial — schizoquant.com
면책사항
해당 정보와 게시물은 금융, 투자, 트레이딩 또는 기타 유형의 조언이나 권장 사항으로 간주되지 않으며, 트레이딩뷰에서 제공하거나 보증하는 것이 아닙니다. 자세한 내용은 이용 약관을 참조하세요.
🟣 Profitable Crypto Strategies | Free Trial — schizoquant.com
면책사항
해당 정보와 게시물은 금융, 투자, 트레이딩 또는 기타 유형의 조언이나 권장 사항으로 간주되지 않으며, 트레이딩뷰에서 제공하거나 보증하는 것이 아닙니다. 자세한 내용은 이용 약관을 참조하세요.