OPEN-SOURCE SCRIPT
업데이트됨 Sessions+ (M1D)
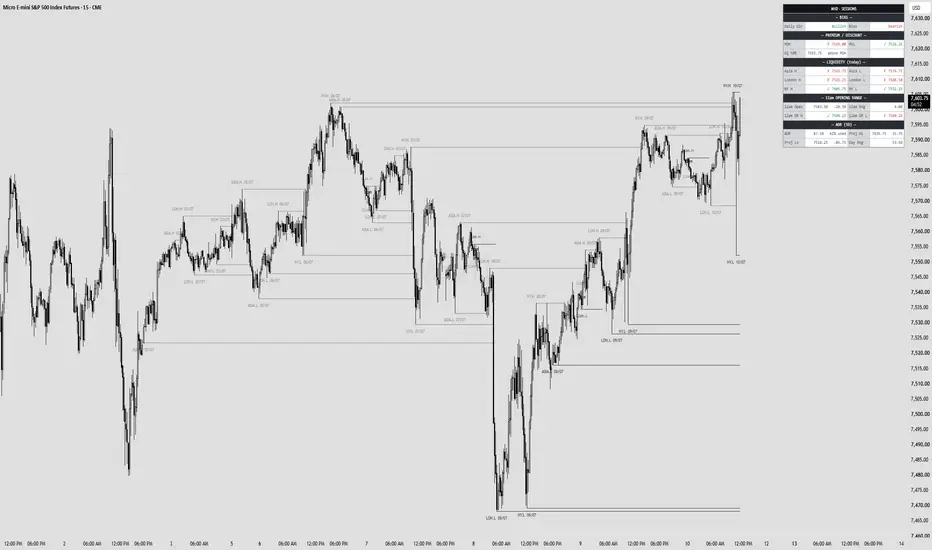
Sessions+ maps the ICT trading day as liquidity. It tracks the Asia, London and New York session highs and lows, frames the midnight (00:00) opening range, and reads your daily bias, premium/discount, resting liquidity and average range on one dashboard — everything you'd otherwise mark up by hand, kept current automatically.
Session levels (Asia / London / NY)
Each session's high and low are drawn from the exact candle that formed the extreme (not the session's start/end time) and projected forward as a liquidity level:
A session high is buy-side liquidity (resting stops above price). A session low is sell-side liquidity (resting stops below price).
A level stays live — bold colour, extending line — until price trades back through it. The moment that happens the level is "swept"/"mitigated": the line freezes in place and dims, so tapped liquidity fades into the background instead of cluttering the chart, but stays visible for context.
Every level carries a dated label (e.g. ASIA.H 06/07) so you always know which day a level belongs to, even several days back.
Session Days Back (0–5) — how many prior days of session levels stay on the chart in addition to today. 0 = today only (default); set to 2 to see the last 3 days of Asia/London/NY levels, each still fading correctly when tapped.
Core session windows plus optional carry windows (Asia carries to 02:00, London to 09:30, NY to 16:00) — the level keeps tracking new extremes through this follow-on period, not just the core window, since price often makes its real high/low after the "session" clock ends.
12am Opening Range
The first 30 minutes of the ICT trading day (00:00–00:30 NY) — the day's first pool of liquidity:
Boxes the 00:00–00:30 range and draws its high and low from the exact wick that made them (labelled 12am.H / 12am.L), plus a centred 12am tag on the box marking the open.
Each level holds until a candle body closes fully through it (not just a wick tap — a confirmed close), or until 05:00 NY (London Kill Zone close) if nothing has taken it by then. Either way, the level then freezes and dims like a session level.
Its own Trading Days Back (0–5), separate from the session setting above, so you can keep a different history depth for the 12am range vs. the sessions.
Dashboard — what every row means
The panel (top-right by default) is a live readout, refreshed every bar:
— BIAS —
Daily Dir: Bullish or Bearish — simply whether price is currently trading above or below today's 00:00 (midnight) open.
Bias: the actual trade bias, based on how far price sits into the prior dealing range (see Premium/Discount below) — not just which side of a line it's on:
Bullish — price is in discount (bought down into the lower half of the range) and below the midnight open — both signals agree.
Lean Bullish — price is in discount, but still trading above the midnight open (signals disagree, weaker read).
Bearish / Lean Bearish — the mirror image, price in premium.
Neutral — price is genuinely camped around the 50% equilibrium (inside the adjustable Bias Neutral Band %), i.e. no real edge either way. Bias never reports a vague "mixed" result — it always commits to a lean unless price is truly balanced.
— PREMIUM / DISCOUNT —
PDH / PWH / PMH and PDL / PWL / PML — the high and low of the dealing range you select in settings: Previous Day, Previous Week, or Previous Month. This is the range ICT traders use to judge premium vs. discount.
Each shows a ✓ (green) if that level is still open/unswept, or a ✗ (red) once price has traded through it this period.
EQ 50% — the exact midpoint of that dealing range (the equilibrium), plus a live read: premium (above EQ — expensive, favour selling), discount (below EQ — cheap, favour buying), or above PDH / below PDL if price has broken outside the range entirely.
— LIQUIDITY (today) —
Asia H / Asia L, London H / London L, NY H / NY L — today's session levels, each with the same ✓ open (green) / ✗ swept (red) marker as above, so you can tell at a glance which pools of liquidity are still resting and which have already been run.
— 12am OPENING RANGE —
12am Open — the exact 00:00 NY opening price, with its live distance from current price.
12am Rng — the size (in points) of the 00:00–00:30 opening range.
12am OR H / 12am OR L — the range's high/low, again with ✓/✗ sweep status.
— ADR (N-Day) — ("ADR" = Average Daily Range — the typical size, in points, of a full trading day over your chosen lookback)
ADR — the average range figure itself, plus % used — how much of that typical daily move has already printed today (e.g. "112% used" means today has already moved further than an average day, which flags a potentially exhausted/extended move).
Proj Hi / Proj Lo — simple range projections: today's low + ADR (a possible high target), and today's high − ADR (a possible low target) — a rough gauge of how much room is statistically "left" in the day.
Day Rng — today's actual realised range so far, for comparison against the ADR figure.
Settings
Sessions — timezone, core + carry windows per session, Session Days Back, line width, mitigated-dim %, session label size.
12am Opening Range — show/hide, range window, Trading Days Back, active window (the 05:00 cutoff), box fill and level line colours/width, label colour.
Dashboard — show/hide, screen position, text size, which Dealing Range to use for premium/discount (Day/Week/Month), ADR lookback length, Bias Neutral Band %, and the bullish/bearish/neutral/open/swept colours.
ICT logic in one line
London and New York run the liquidity that Asia and the prior period left resting; the midnight open is the true day open and the pivot for premium/discount; the 12am range is the very first pool the new day creates. This tool keeps all four of those — sessions, midnight range, dealing-range bias, and average range — in front of you at once.
Notes
Best on intraday timeframes (30 minutes or lower recommended for the 12am Opening Range; the session levels work across any intraday timeframe).
Session-based (not a fixed UTC offset), so everything tracks correctly through daylight-saving changes.
A level's date stamps when it opened, not the trading day it belongs to — e.g. Asia opens at 6pm NY, so its label shows the prior calendar date, which is when that range actually printed.
Daily/weekly/monthly and ADR data are pulled anti-repaint (confirmed prior-period values only); every swept/taken state is confirmed on candle close, never mid-bar.
Built by M1D. For education and the study of price delivery — not financial advice.
(New and improved version of the previous "Sessions Highs And Lows Unmitigated" script.)
Session levels (Asia / London / NY)
Each session's high and low are drawn from the exact candle that formed the extreme (not the session's start/end time) and projected forward as a liquidity level:
A session high is buy-side liquidity (resting stops above price). A session low is sell-side liquidity (resting stops below price).
A level stays live — bold colour, extending line — until price trades back through it. The moment that happens the level is "swept"/"mitigated": the line freezes in place and dims, so tapped liquidity fades into the background instead of cluttering the chart, but stays visible for context.
Every level carries a dated label (e.g. ASIA.H 06/07) so you always know which day a level belongs to, even several days back.
Session Days Back (0–5) — how many prior days of session levels stay on the chart in addition to today. 0 = today only (default); set to 2 to see the last 3 days of Asia/London/NY levels, each still fading correctly when tapped.
Core session windows plus optional carry windows (Asia carries to 02:00, London to 09:30, NY to 16:00) — the level keeps tracking new extremes through this follow-on period, not just the core window, since price often makes its real high/low after the "session" clock ends.
12am Opening Range
The first 30 minutes of the ICT trading day (00:00–00:30 NY) — the day's first pool of liquidity:
Boxes the 00:00–00:30 range and draws its high and low from the exact wick that made them (labelled 12am.H / 12am.L), plus a centred 12am tag on the box marking the open.
Each level holds until a candle body closes fully through it (not just a wick tap — a confirmed close), or until 05:00 NY (London Kill Zone close) if nothing has taken it by then. Either way, the level then freezes and dims like a session level.
Its own Trading Days Back (0–5), separate from the session setting above, so you can keep a different history depth for the 12am range vs. the sessions.
Dashboard — what every row means
The panel (top-right by default) is a live readout, refreshed every bar:
— BIAS —
Daily Dir: Bullish or Bearish — simply whether price is currently trading above or below today's 00:00 (midnight) open.
Bias: the actual trade bias, based on how far price sits into the prior dealing range (see Premium/Discount below) — not just which side of a line it's on:
Bullish — price is in discount (bought down into the lower half of the range) and below the midnight open — both signals agree.
Lean Bullish — price is in discount, but still trading above the midnight open (signals disagree, weaker read).
Bearish / Lean Bearish — the mirror image, price in premium.
Neutral — price is genuinely camped around the 50% equilibrium (inside the adjustable Bias Neutral Band %), i.e. no real edge either way. Bias never reports a vague "mixed" result — it always commits to a lean unless price is truly balanced.
— PREMIUM / DISCOUNT —
PDH / PWH / PMH and PDL / PWL / PML — the high and low of the dealing range you select in settings: Previous Day, Previous Week, or Previous Month. This is the range ICT traders use to judge premium vs. discount.
Each shows a ✓ (green) if that level is still open/unswept, or a ✗ (red) once price has traded through it this period.
EQ 50% — the exact midpoint of that dealing range (the equilibrium), plus a live read: premium (above EQ — expensive, favour selling), discount (below EQ — cheap, favour buying), or above PDH / below PDL if price has broken outside the range entirely.
— LIQUIDITY (today) —
Asia H / Asia L, London H / London L, NY H / NY L — today's session levels, each with the same ✓ open (green) / ✗ swept (red) marker as above, so you can tell at a glance which pools of liquidity are still resting and which have already been run.
— 12am OPENING RANGE —
12am Open — the exact 00:00 NY opening price, with its live distance from current price.
12am Rng — the size (in points) of the 00:00–00:30 opening range.
12am OR H / 12am OR L — the range's high/low, again with ✓/✗ sweep status.
— ADR (N-Day) — ("ADR" = Average Daily Range — the typical size, in points, of a full trading day over your chosen lookback)
ADR — the average range figure itself, plus % used — how much of that typical daily move has already printed today (e.g. "112% used" means today has already moved further than an average day, which flags a potentially exhausted/extended move).
Proj Hi / Proj Lo — simple range projections: today's low + ADR (a possible high target), and today's high − ADR (a possible low target) — a rough gauge of how much room is statistically "left" in the day.
Day Rng — today's actual realised range so far, for comparison against the ADR figure.
Settings
Sessions — timezone, core + carry windows per session, Session Days Back, line width, mitigated-dim %, session label size.
12am Opening Range — show/hide, range window, Trading Days Back, active window (the 05:00 cutoff), box fill and level line colours/width, label colour.
Dashboard — show/hide, screen position, text size, which Dealing Range to use for premium/discount (Day/Week/Month), ADR lookback length, Bias Neutral Band %, and the bullish/bearish/neutral/open/swept colours.
ICT logic in one line
London and New York run the liquidity that Asia and the prior period left resting; the midnight open is the true day open and the pivot for premium/discount; the 12am range is the very first pool the new day creates. This tool keeps all four of those — sessions, midnight range, dealing-range bias, and average range — in front of you at once.
Notes
Best on intraday timeframes (30 minutes or lower recommended for the 12am Opening Range; the session levels work across any intraday timeframe).
Session-based (not a fixed UTC offset), so everything tracks correctly through daylight-saving changes.
A level's date stamps when it opened, not the trading day it belongs to — e.g. Asia opens at 6pm NY, so its label shows the prior calendar date, which is when that range actually printed.
Daily/weekly/monthly and ADR data are pulled anti-repaint (confirmed prior-period values only); every swept/taken state is confirmed on candle close, never mid-bar.
Built by M1D. For education and the study of price delivery — not financial advice.
(New and improved version of the previous "Sessions Highs And Lows Unmitigated" script.)
릴리즈 노트
**NY AM Default Setting 9:30am changed to 7:30am start**릴리즈 노트
What's newOrigin-anchored labels — every session and 12am OR label now sits at the candle that formed the level (floated above highs, below lows), with the line running forward from there. Labels fan out across the chart instead of stacking on the right edge — much cleaner once you show more history.
Session history up to 15 days (was 5) — turn Session Days Back up to keep more prior Asia / London / NY levels on the chart; older ones dim as they're mitigated.
New "Show Sessions" panel
- Individual on/off toggles for Asia, London and NY AM.
- Two new optional sessions — NY Lunch (12:00–13:00) and NY PM (13:30–16:00) — off by default, with editable windows.
- A Session Labels on/off toggle for a lines-only look.
오픈 소스 스크립트
트레이딩뷰의 진정한 정신에 따라, 이 스크립트의 작성자는 이를 오픈소스로 공개하여 트레이더들이 기능을 검토하고 검증할 수 있도록 했습니다. 작성자에게 찬사를 보냅니다! 이 코드는 무료로 사용할 수 있지만, 코드를 재게시하는 경우 하우스 룰이 적용된다는 점을 기억하세요.

면책사항
해당 정보와 게시물은 금융, 투자, 트레이딩 또는 기타 유형의 조언이나 권장 사항으로 간주되지 않으며, 트레이딩뷰에서 제공하거나 보증하는 것이 아닙니다. 자세한 내용은 이용 약관을 참조하세요.
오픈 소스 스크립트
트레이딩뷰의 진정한 정신에 따라, 이 스크립트의 작성자는 이를 오픈소스로 공개하여 트레이더들이 기능을 검토하고 검증할 수 있도록 했습니다. 작성자에게 찬사를 보냅니다! 이 코드는 무료로 사용할 수 있지만, 코드를 재게시하는 경우 하우스 룰이 적용된다는 점을 기억하세요.
면책사항
해당 정보와 게시물은 금융, 투자, 트레이딩 또는 기타 유형의 조언이나 권장 사항으로 간주되지 않으며, 트레이딩뷰에서 제공하거나 보증하는 것이 아닙니다. 자세한 내용은 이용 약관을 참조하세요.