OPEN-SOURCE SCRIPT
Developing FAB4 Zone
# Developing FAB4 Zone — Indicator Documentation
## Overview
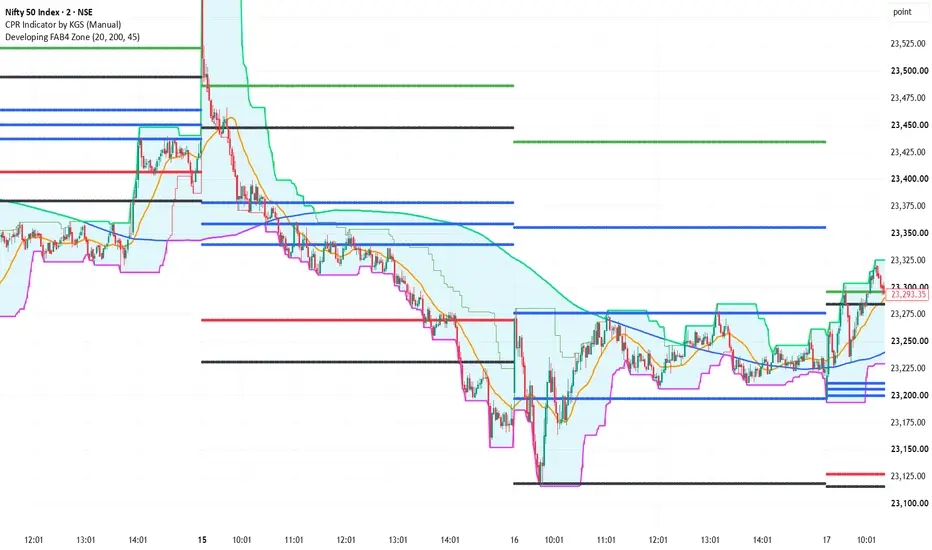
The Developing FAB4 Zone is a TradingView indicator designed to visualize a dynamic price zone using four key reference elements: the 20 SMA, 200 SMA, current day's closing price, and the high and low of the last 45 minutes.
## Calculation Logic
- **20 SMA:** Identifies the short-term trend.
- **200 SMA:** Provides a longer-term trend reference.
- **Current day's closing price:** Uses the latest available price/close during the ongoing session.
- **Last 45-minute high and low:** Tracks the highest and lowest prices over a rolling 45-minute window. On a 2-minute chart, this uses 23 candles (approximately 46 minutes).
## Zone Formation
- **Zone High:** The highest value among the 20 SMA, 200 SMA, current price, and rolling 45-minute high.
- **Zone Low:** The lowest value among the 20 SMA, 200 SMA, current price, and rolling 45-minute low.
The zone updates as market conditions change, allowing traders to observe shifts in price structure and key reference levels.
## Intended Use
The indicator is intended to help traders visualize dynamic support and resistance areas, monitor price relative to moving averages, and identify potential breakout or rejection zones.
**Note:** This is a custom interpretation of the FAB4 concept, not a verified reproduction of Oliver Velez's exact trading rules. The indicator provides visual reference levels and does not independently generate trade signals.
## Overview
The Developing FAB4 Zone is a TradingView indicator designed to visualize a dynamic price zone using four key reference elements: the 20 SMA, 200 SMA, current day's closing price, and the high and low of the last 45 minutes.
## Calculation Logic
- **20 SMA:** Identifies the short-term trend.
- **200 SMA:** Provides a longer-term trend reference.
- **Current day's closing price:** Uses the latest available price/close during the ongoing session.
- **Last 45-minute high and low:** Tracks the highest and lowest prices over a rolling 45-minute window. On a 2-minute chart, this uses 23 candles (approximately 46 minutes).
## Zone Formation
- **Zone High:** The highest value among the 20 SMA, 200 SMA, current price, and rolling 45-minute high.
- **Zone Low:** The lowest value among the 20 SMA, 200 SMA, current price, and rolling 45-minute low.
The zone updates as market conditions change, allowing traders to observe shifts in price structure and key reference levels.
## Intended Use
The indicator is intended to help traders visualize dynamic support and resistance areas, monitor price relative to moving averages, and identify potential breakout or rejection zones.
**Note:** This is a custom interpretation of the FAB4 concept, not a verified reproduction of Oliver Velez's exact trading rules. The indicator provides visual reference levels and does not independently generate trade signals.
오픈 소스 스크립트
트레이딩뷰의 진정한 정신에 따라, 이 스크립트의 작성자는 이를 오픈소스로 공개하여 트레이더들이 기능을 검토하고 검증할 수 있도록 했습니다. 작성자에게 찬사를 보냅니다! 이 코드는 무료로 사용할 수 있지만, 코드를 재게시하는 경우 하우스 룰이 적용된다는 점을 기억하세요.

면책사항
해당 정보와 게시물은 금융, 투자, 트레이딩 또는 기타 유형의 조언이나 권장 사항으로 간주되지 않으며, 트레이딩뷰에서 제공하거나 보증하는 것이 아닙니다. 자세한 내용은 이용 약관을 참조하세요.
오픈 소스 스크립트
트레이딩뷰의 진정한 정신에 따라, 이 스크립트의 작성자는 이를 오픈소스로 공개하여 트레이더들이 기능을 검토하고 검증할 수 있도록 했습니다. 작성자에게 찬사를 보냅니다! 이 코드는 무료로 사용할 수 있지만, 코드를 재게시하는 경우 하우스 룰이 적용된다는 점을 기억하세요.
면책사항
해당 정보와 게시물은 금융, 투자, 트레이딩 또는 기타 유형의 조언이나 권장 사항으로 간주되지 않으며, 트레이딩뷰에서 제공하거나 보증하는 것이 아닙니다. 자세한 내용은 이용 약관을 참조하세요.