OPEN-SOURCE SCRIPT
업데이트됨 Previous Day/Week/Month High/Low
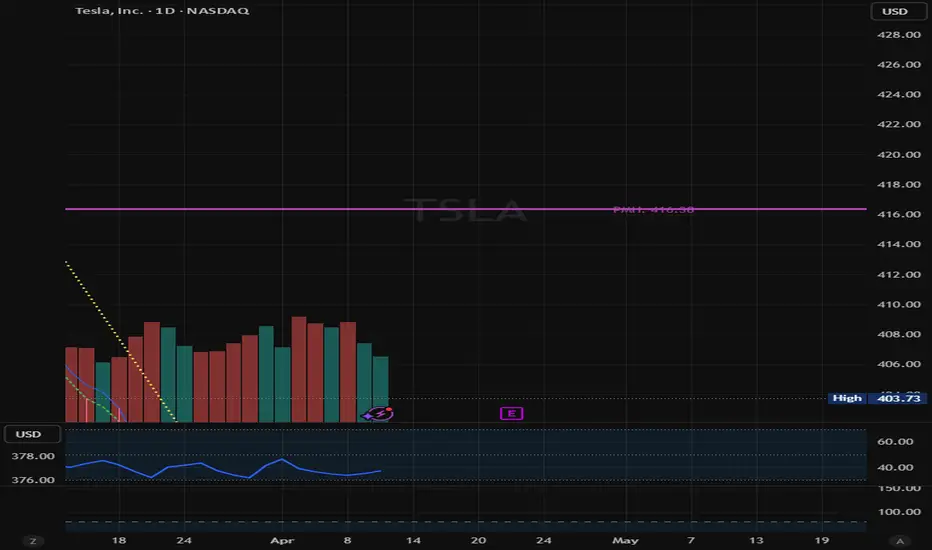
This script plots the previous day, week and month high and low.
릴리즈 노트
//version=6indicator("True Anchor H/L - Always-On Build", overlay=true, max_bars_back=5000)
// --- HELPER FUNCTION: Convert String to Line Style ---
getStyle(s) =>
s == "Dashed" ? line.style_dashed : s == "Dotted" ? line.style_dotted : line.style_solid
// --- GUI INPUTS ---
grp_g = "Global Settings"
label_off = input.int(6, "Label Vertical Offset (Ticks)", minval=0, group=grp_g)
// 10-Minute
grp_10 = "10-Minute Levels"
show_10 = input.bool(true, "Show P10mH/P10mL", group=grp_10)
col_10 = input.color(#9598a1, "Color", group=grp_10)
wid_10 = input.int(1, "Weight", minval=1, maxval=5, group=grp_10)
sty_10 = input.string("Solid", "Style", options=["Solid", "Dashed", "Dotted"], group=grp_10)
// Hourly
grp_h = "Hour Levels"
show_h = input.bool(true, "Show PHH/PHL", group=grp_h)
col_h = input.color(#ff9800, "Color", group=grp_h)
wid_h = input.int(1, "Weight", minval=1, maxval=5, group=grp_h)
sty_h = input.string("Solid", "Style", options=["Solid", "Dashed", "Dotted"], group=grp_h)
// Daily
grp_d = "Daily Levels"
show_d = input.bool(true, "Show Daily PDH/PDL", group=grp_d)
col_d = input.color(#86c7e6, "Color", group=grp_d)
wid_d = input.int(1, "Weight", minval=1, maxval=5, group=grp_d)
sty_d = input.string("Solid", "Style", options=["Solid", "Dashed", "Dotted"], group=grp_d)
// Weekly
grp_w = "Weekly Levels"
show_w = input.bool(true, "Show PWH/PWL", group=grp_w)
col_w = input.color(#e4bec4, "Color", group=grp_w)
wid_w = input.int(2, "Weight", minval=1, maxval=5, group=grp_w)
sty_w = input.string("Solid", "Style", options=["Solid", "Dashed", "Dotted"], group=grp_w)
// Monthly
grp_m = "Monthly Levels"
show_m = input.bool(true, "Show Monthly PMH/PML", group=grp_m)
col_m = input.color(#ac43ac, "Color", group=grp_m)
wid_m = input.int(2, "Weight", minval=1, maxval=5, group=grp_m)
sty_m = input.string("Solid", "Style", options=["Solid", "Dashed", "Dotted"], group=grp_m)
// --- 1. Fetch Price Levels ---
p10h = request.security(syminfo.tickerid, "10", high[1], lookahead=barmerge.lookahead_on)
p10l = request.security(syminfo.tickerid, "10", low[1], lookahead=barmerge.lookahead_on)
phh = request.security(syminfo.tickerid, "60", high[1], lookahead=barmerge.lookahead_on)
phl = request.security(syminfo.tickerid, "60", low[1], lookahead=barmerge.lookahead_on)
phd = request.security(syminfo.tickerid, "D", high[1], lookahead=barmerge.lookahead_on)
pld = request.security(syminfo.tickerid, "D", low[1], lookahead=barmerge.lookahead_on)
phw = request.security(syminfo.tickerid, "W", high[1], lookahead=barmerge.lookahead_on)
plw = request.security(syminfo.tickerid, "W", low[1], lookahead=barmerge.lookahead_on)
phm = request.security(syminfo.tickerid, "M", high[1], lookahead=barmerge.lookahead_on)
plm = request.security(syminfo.tickerid, "M", low[1], lookahead=barmerge.lookahead_on)
// --- 2. Anchoring Logic ---
tenMinAnchor = ta.valuewhen(ta.change(time("10")) != 0, bar_index, 1)
hourAnchor = ta.valuewhen(ta.change(time("60")) != 0, bar_index, 1)
dayAnchor = ta.valuewhen(ta.change(time("D")) != 0, bar_index, 1)
weekAnchor = ta.valuewhen(ta.change(time("W")) != 0, bar_index, 1)
monthAnchor = ta.valuewhen(ta.change(time("M")) != 0, bar_index, 1)
// --- 3. Drawing Function ---
drawLevel(anchorBar, price, useColor, width, styleStr, labelText, xOffset, isVisible) =>
if isVisible and not na(price) and not na(anchorBar)
int startX = int(anchorBar)
int endX = bar_index
if startX >= endX
startX := endX - 1
line.new(startX, price, endX, price, xloc.bar_index, extend.right, useColor, style=getStyle(styleStr), width=width, force_overlay=true)
float labelY = price - (syminfo.mintick * label_off)
label.new(x=endX + xOffset, y=labelY, text=labelText, xloc=xloc.bar_index, color=color(na), textcolor=useColor, style=label.style_label_left, size=size.small, force_overlay=true)
// --- 4. Execution ---
if barstate.islast
// Cleanup
line_arr = line.all
if array.size(line_arr) > 0
for i = 0 to array.size(line_arr) - 1
line.delete(array.get(line_arr, i))
label_arr = label.all
if array.size(label_arr) > 0
for i = 0 to array.size(label_arr) - 1
label.delete(array.get(label_arr, i))
// Render Logic (Filters removed to ensure visibility on all timeframes)
drawLevel(tenMinAnchor, p10h, col_10, wid_10, sty_10, "P10mH", 1, show_10)
drawLevel(tenMinAnchor, p10l, col_10, wid_10, sty_10, "P10mL", 1, show_10)
drawLevel(hourAnchor, phh, col_h, wid_h, sty_h, "PHH", 4, show_h)
drawLevel(hourAnchor, phl, col_h, wid_h, sty_h, "PHL", 4, show_h)
drawLevel(dayAnchor, phd, col_d, wid_d, sty_d, "PDH", 7, show_d)
drawLevel(dayAnchor, pld, col_d, wid_d, sty_d, "PDL", 7, show_d)
drawLevel(weekAnchor, phw, col_w, wid_w, sty_w, "PWH", 10, show_w)
drawLevel(weekAnchor, plw, col_w, wid_w, sty_w, "PWL", 10, show_w)
drawLevel(monthAnchor, phm, col_m, wid_m, sty_m, "PMH", 13, show_m)
drawLevel(monthAnchor, plm, col_m, wid_m, sty_m, "PML", 13, show_m)
릴리즈 노트
This will help you plot previous high timeframe levels automatically.you can change line style, weight and text placement.
this will only show smaller time frames when you go to that time frame (i.e. the 1H will only show the 1D, 1W and 1M levels while the 10m frame will also plot the 10m levels)
릴리즈 노트
.오픈 소스 스크립트
트레이딩뷰의 진정한 정신에 따라, 이 스크립트의 작성자는 이를 오픈소스로 공개하여 트레이더들이 기능을 검토하고 검증할 수 있도록 했습니다. 작성자에게 찬사를 보냅니다! 이 코드는 무료로 사용할 수 있지만, 코드를 재게시하는 경우 하우스 룰이 적용된다는 점을 기억하세요.

면책사항
해당 정보와 게시물은 금융, 투자, 트레이딩 또는 기타 유형의 조언이나 권장 사항으로 간주되지 않으며, 트레이딩뷰에서 제공하거나 보증하는 것이 아닙니다. 자세한 내용은 이용 약관을 참조하세요.
오픈 소스 스크립트
트레이딩뷰의 진정한 정신에 따라, 이 스크립트의 작성자는 이를 오픈소스로 공개하여 트레이더들이 기능을 검토하고 검증할 수 있도록 했습니다. 작성자에게 찬사를 보냅니다! 이 코드는 무료로 사용할 수 있지만, 코드를 재게시하는 경우 하우스 룰이 적용된다는 점을 기억하세요.
면책사항
해당 정보와 게시물은 금융, 투자, 트레이딩 또는 기타 유형의 조언이나 권장 사항으로 간주되지 않으며, 트레이딩뷰에서 제공하거나 보증하는 것이 아닙니다. 자세한 내용은 이용 약관을 참조하세요.