OPEN-SOURCE SCRIPT
업데이트됨 NYSE Advance/Decline
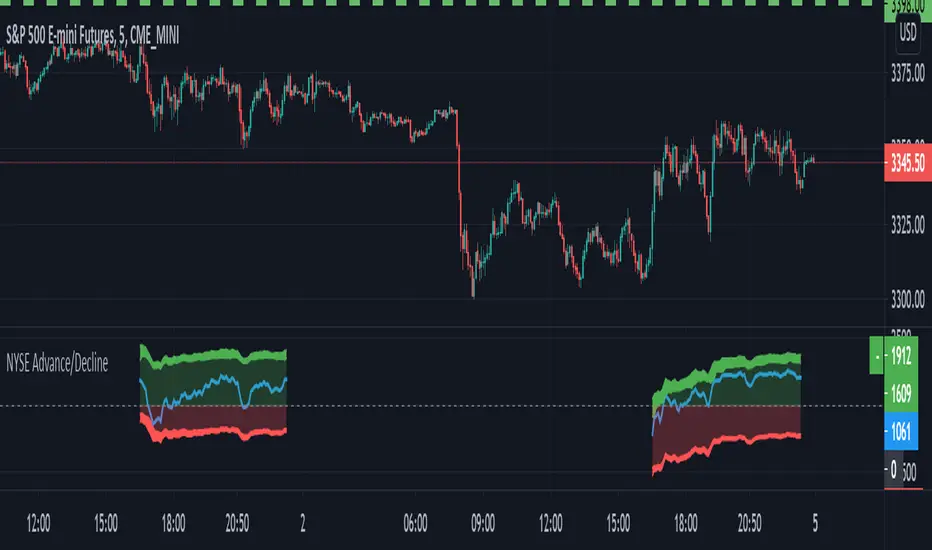
An indicator for traders who trade intraday on the US market. It makes use of the symbols made available by TradingView to show the number of advancing vs declining stocks.
The GREEN AREA represents advancing issues. The INTENSE GREEN AREA represents the advancing issues at daily high.
The RED AREA represents declining issues. The INTENSE RED AREA represents the declining issues at daily low.
The part above the BLUE LINE represents issues which are trading above their VWAP (volume-weighted average prices).
The GREEN AREA represents advancing issues. The INTENSE GREEN AREA represents the advancing issues at daily high.
The RED AREA represents declining issues. The INTENSE RED AREA represents the declining issues at daily low.
The part above the BLUE LINE represents issues which are trading above their VWAP (volume-weighted average prices).
릴리즈 노트
Small modification and bugfix (stopped showing a third red line (the number of stocks above 5-day moving average) which didn't make any sense because it wasn't intuitive - it wasn't updated in real time but only once a day).오픈 소스 스크립트
트레이딩뷰의 진정한 정신에 따라, 이 스크립트의 작성자는 이를 오픈소스로 공개하여 트레이더들이 기능을 검토하고 검증할 수 있도록 했습니다. 작성자에게 찬사를 보냅니다! 이 코드는 무료로 사용할 수 있지만, 코드를 재게시하는 경우 하우스 룰이 적용된다는 점을 기억하세요.

면책사항
해당 정보와 게시물은 금융, 투자, 트레이딩 또는 기타 유형의 조언이나 권장 사항으로 간주되지 않으며, 트레이딩뷰에서 제공하거나 보증하는 것이 아닙니다. 자세한 내용은 이용 약관을 참조하세요.
오픈 소스 스크립트
트레이딩뷰의 진정한 정신에 따라, 이 스크립트의 작성자는 이를 오픈소스로 공개하여 트레이더들이 기능을 검토하고 검증할 수 있도록 했습니다. 작성자에게 찬사를 보냅니다! 이 코드는 무료로 사용할 수 있지만, 코드를 재게시하는 경우 하우스 룰이 적용된다는 점을 기억하세요.
면책사항
해당 정보와 게시물은 금융, 투자, 트레이딩 또는 기타 유형의 조언이나 권장 사항으로 간주되지 않으며, 트레이딩뷰에서 제공하거나 보증하는 것이 아닙니다. 자세한 내용은 이용 약관을 참조하세요.