업데이트됨
Daily Bias ( with Alerts) By: Munny Mike
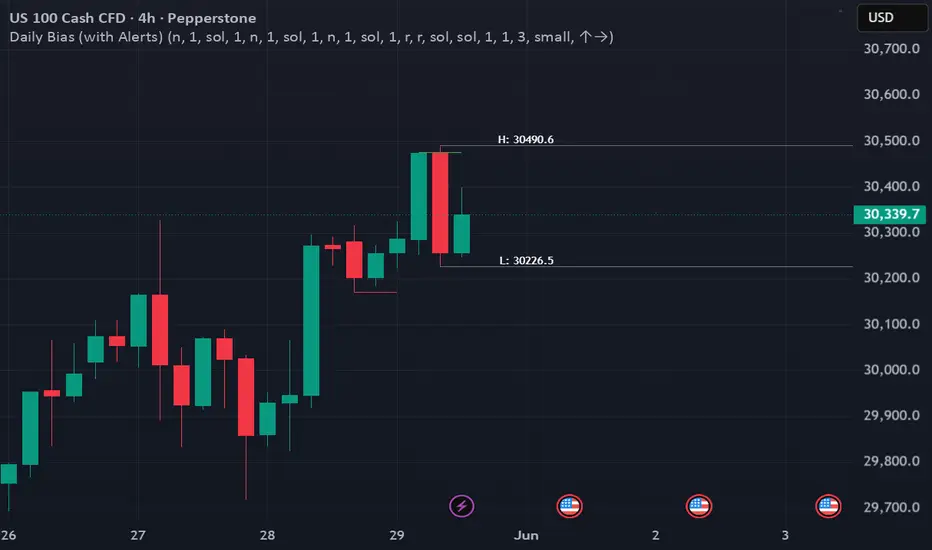
Daily Bias (with Alerts) identifies market bias based on daily price action: Bullish when previous close > high of two days ago, Bearish when previous close < low of two days ago, otherwise Consolidation. It draws horizontal lines from the previous candle’s high/low accordingly, with full customization of color, style, extension, and line count. The indicator also marks the previous candle’s high/low with optional price labels, provides breakout alerts (above prior high / below prior low), and includes an optional on‑chart table displaying both daily and (on ≤4h charts) intraday bias. Designed for intraday and multi‑timeframe traders who follow daily structure.
 NAS100
 릴리즈 노트
Daily Bias (with Alerts) identifies market bias based on daily price action: Bullish when previous close > high of two days ago, Bearish when previous close < low of two days ago, otherwise Consolidation. It draws horizontal lines from the previous candle’s high/low accordingly, with full customization of color, style, extension, and line count. The indicator also marks the previous candle’s high/low with optional price labels, provides breakout alerts (above prior high / below prior low), and includes an optional on‑chart table displaying both daily and (on ≤4h charts) intraday bias. Designed for intraday and multi‑timeframe traders who follow daily structure.
면책사항
해당 정보와 게시물은 금융, 투자, 트레이딩 또는 기타 유형의 조언이나 권장 사항으로 간주되지 않으며, 트레이딩뷰에서 제공하거나 보증하는 것이 아닙니다. 자세한 내용은 이용 약관을 참조하세요.
면책사항
해당 정보와 게시물은 금융, 투자, 트레이딩 또는 기타 유형의 조언이나 권장 사항으로 간주되지 않으며, 트레이딩뷰에서 제공하거나 보증하는 것이 아닙니다. 자세한 내용은 이용 약관을 참조하세요.