OPEN-SOURCE SCRIPT
Visual Trading Zones
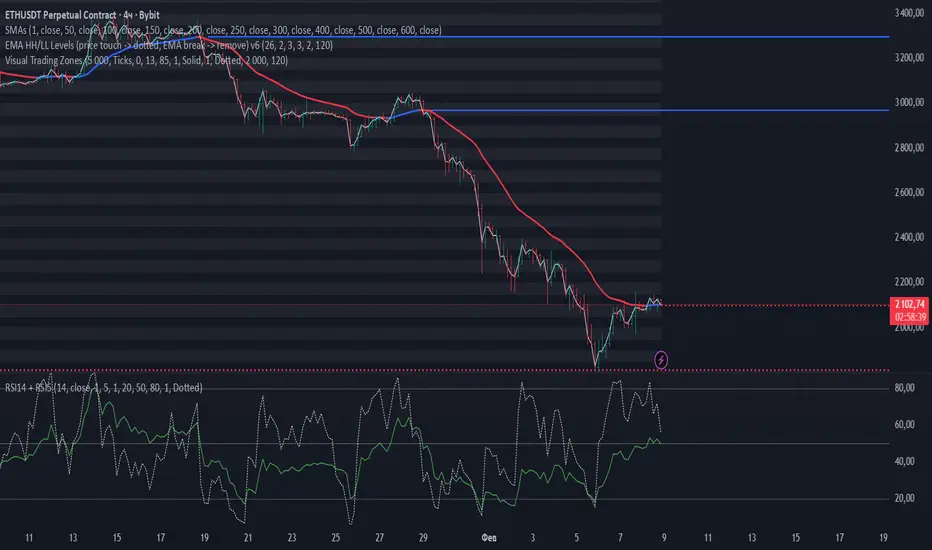
Visual Trading Zones is a chart-based indicator designed to display clear and structured price zones using evenly spaced levels.
The indicator automatically builds horizontal zones across the visible price range and helps traders visually identify potential areas of interest such as support, resistance, and reaction zones.
Key Features
Displays horizontal price zones with a fixed step
Optional main levels and sub-levels inside each zone
Clean and minimal visual presentation
Works on any market and timeframe
Fully customizable colors, line styles, and zone transparency
No signals, no alerts — purely visual analysis tool
How It Works
Price zones are constructed using a user-defined step size.
Each zone is visually highlighted, allowing traders to quickly see how price interacts with these areas over time.
The indicator does not repaint and does not generate trading signals.
It is intended to be used as a visual framework alongside any trading strategy.
Recommended Use
Identifying potential support and resistance zones
Market structure and range analysis
Confluence with price action, indicators, or volume tools
⚙️ Settings Overview
Step — distance between price zones
Step Unit — ticks or pips (for FX instruments)
SubLevels — number of internal levels within each zone
Show Zones / Lines / Prices — visual display options
Range Bars — number of bars used to build zones
Style Settings — colors, line styles, transparency
The indicator automatically builds horizontal zones across the visible price range and helps traders visually identify potential areas of interest such as support, resistance, and reaction zones.
Key Features
Displays horizontal price zones with a fixed step
Optional main levels and sub-levels inside each zone
Clean and minimal visual presentation
Works on any market and timeframe
Fully customizable colors, line styles, and zone transparency
No signals, no alerts — purely visual analysis tool
How It Works
Price zones are constructed using a user-defined step size.
Each zone is visually highlighted, allowing traders to quickly see how price interacts with these areas over time.
The indicator does not repaint and does not generate trading signals.
It is intended to be used as a visual framework alongside any trading strategy.
Recommended Use
Identifying potential support and resistance zones
Market structure and range analysis
Confluence with price action, indicators, or volume tools
⚙️ Settings Overview
Step — distance between price zones
Step Unit — ticks or pips (for FX instruments)
SubLevels — number of internal levels within each zone
Show Zones / Lines / Prices — visual display options
Range Bars — number of bars used to build zones
Style Settings — colors, line styles, transparency
오픈 소스 스크립트
트레이딩뷰의 진정한 정신에 따라, 이 스크립트의 작성자는 이를 오픈소스로 공개하여 트레이더들이 기능을 검토하고 검증할 수 있도록 했습니다. 작성자에게 찬사를 보냅니다! 이 코드는 무료로 사용할 수 있지만, 코드를 재게시하는 경우 하우스 룰이 적용된다는 점을 기억하세요.

면책사항
해당 정보와 게시물은 금융, 투자, 트레이딩 또는 기타 유형의 조언이나 권장 사항으로 간주되지 않으며, 트레이딩뷰에서 제공하거나 보증하는 것이 아닙니다. 자세한 내용은 이용 약관을 참조하세요.
오픈 소스 스크립트
트레이딩뷰의 진정한 정신에 따라, 이 스크립트의 작성자는 이를 오픈소스로 공개하여 트레이더들이 기능을 검토하고 검증할 수 있도록 했습니다. 작성자에게 찬사를 보냅니다! 이 코드는 무료로 사용할 수 있지만, 코드를 재게시하는 경우 하우스 룰이 적용된다는 점을 기억하세요.
면책사항
해당 정보와 게시물은 금융, 투자, 트레이딩 또는 기타 유형의 조언이나 권장 사항으로 간주되지 않으며, 트레이딩뷰에서 제공하거나 보증하는 것이 아닙니다. 자세한 내용은 이용 약관을 참조하세요.