OPEN-SOURCE SCRIPT
업데이트됨 VRVP Clone + Multi-POC -- PerroGordo
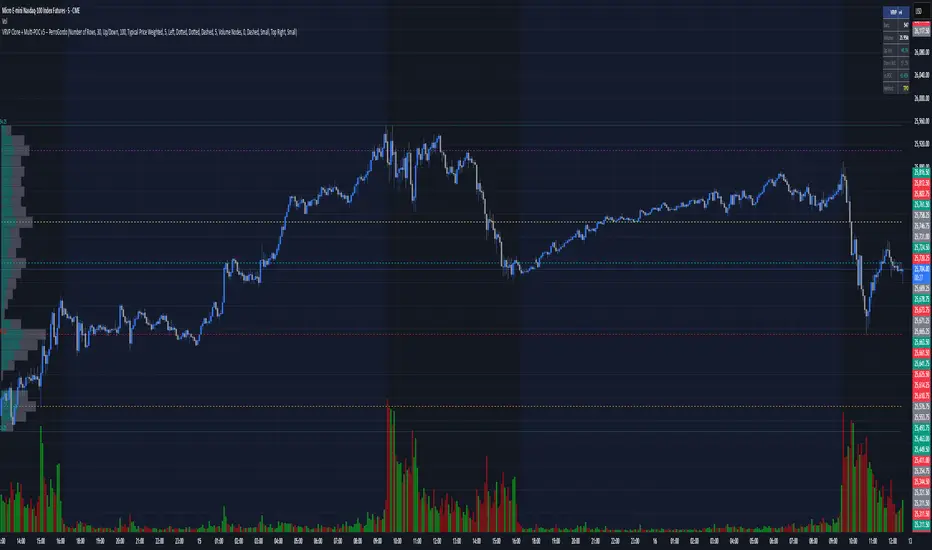
VRVP Clone + Multi-POC
Overview
VRVP Clone + Multi-POC replicates TradingView's native Visible Range Volume Profile with several practical enhancements. The indicator displays volume distribution across price levels for the visible chart range, which is useful for identifying high-volume nodes, support/resistance zones, and areas of price acceptance.
The main differentiator from the built-in VRVP is support for multiple Point of Control (POC) lines with an intelligent peak detection algorithm. Instead of just showing the single highest-volume level, you can identify distinct volume clusters across different price zones.
Features
Dynamic Visible Range
Multiple POC Detection (1-8 levels)
Volume Display Modes
Value Area
Positioning Options
Additional Features
+++++
How It Works
Volume from each bar is distributed across price rows based on the bar's high-low range. The allocation is proportional - if a bar spans 3 rows with 60% overlap on one row, that row receives 60% of the bar's volume.
Volume Nodes Mode identifies local peaks in the distribution (rows where volume exceeds both neighbors), then selects the highest peaks while enforcing minimum separation. This surfaces distinct support/resistance clusters rather than stacking all POC lines in a single high-volume area.
+++++
Settings
Inputs
Setting - Description
Enhancements
Setting - Description
Style
Setting - Description
+++++
Applications
Support/Resistance Identification
High-volume nodes tend to act as price magnets. Multiple POCs reveal layered S/R zones that aren't visible with a single POC.
Fair Value Reference
The Value Area represents where 70% of volume traded. Price tends to revert to this zone.
Volume Gap Analysis
Low-volume areas between POCs indicate prices that were rejected quickly - potential breakout or breakdown levels.
Market Structure
Multiple POCs across price levels show where the market has found acceptance, useful for distinguishing range-bound conditions from trending moves.
+++++
Practical Notes
+++++
Requirements
+++++
Version History
v1.1
- Added Volume Nodes mode with peak detection
- Expanded to 8 POC levels
- Added Min Node Separation setting
- Fixed POC label positioning for left placement
- Added black outlines to Up/Down volume bars
v1.0
- Initial release replicating VRVP with multi-POC enhancement
- Delta Intensity mode
- Statistics table
Overview
VRVP Clone + Multi-POC replicates TradingView's native Visible Range Volume Profile with several practical enhancements. The indicator displays volume distribution across price levels for the visible chart range, which is useful for identifying high-volume nodes, support/resistance zones, and areas of price acceptance.
The main differentiator from the built-in VRVP is support for multiple Point of Control (POC) lines with an intelligent peak detection algorithm. Instead of just showing the single highest-volume level, you can identify distinct volume clusters across different price zones.
Features
Dynamic Visible Range
- Recalculates automatically on scroll or zoom
- Analyzes only visible bars
- Profile width scales proportionally to view
Multiple POC Detection (1-8 levels)
- Volume Nodes Mode: Peak detection algorithm finds local volume maxima across distinct price clusters
- Highest Rows Mode: Traditional approach - top N rows by raw volume
- Configurable minimum separation between nodes to prevent bunching
- Individual colors for each POC level
Volume Display Modes
- Up/Down: Split bars showing buy vs. sell volume with black outlines for visual separation
- Total: Single bar colored by dominant direction
- Delta: Net volume (buy minus sell)
- Delta Intensity: Gradient coloring indicating buyer/seller dominance strength per row
Value Area
- Configurable percentage (default 70%)
- VAH and VAL lines with customizable styles
- Separate colors for volume inside vs. outside the Value Area
Positioning Options
- Left or Right placement
- Adjustable profile width as percentage of visible range
- Row configuration via "Number of Rows" or "Ticks Per Row"
Additional Features
- Statistics table showing bars analyzed, total volume, up/down percentages, price vs POC
- POC price labels on chart
- Line style options (Solid, Dashed, Dotted)
+++++
How It Works
Volume from each bar is distributed across price rows based on the bar's high-low range. The allocation is proportional - if a bar spans 3 rows with 60% overlap on one row, that row receives 60% of the bar's volume.
Volume Nodes Mode identifies local peaks in the distribution (rows where volume exceeds both neighbors), then selects the highest peaks while enforcing minimum separation. This surfaces distinct support/resistance clusters rather than stacking all POC lines in a single high-volume area.
+++++
Settings
Inputs
Setting - Description
- Rows Layout - "Number of Rows" or "Ticks Per Row"
- Row Size - Number of rows (24-200) or ticks per row
- Volume - "Up/Down", "Total", "Delta", or source selection
- Value Area % - Percentage of volume for Value Area (default 70%)
- Profile Width % - Width as percentage of visible bars
- Placement - "Right" or "Left" side of chart
Enhancements
Setting - Description
- Number of POCs | 1-8 POC lines |
- POC Mode - "Volume Nodes" (peak detection) or "Highest Rows" (traditional)
- Min Node Separation - Minimum rows between nodes (0 = auto-calculate)
- Delta Intensity Mode - Gradient coloring by dominance
- Show Stats Table - Display analysis statistics
Style
Setting - Description
- Up/Down Volume Colors - Buy/sell volume colors
- Value Area Colors - Colors for VA regions
- POC/VAH/VAL Colors - Line colors and styles
- POC 2-8 Colors - Colors for additional POC levels
+++++
Applications
Support/Resistance Identification
High-volume nodes tend to act as price magnets. Multiple POCs reveal layered S/R zones that aren't visible with a single POC.
Fair Value Reference
The Value Area represents where 70% of volume traded. Price tends to revert to this zone.
Volume Gap Analysis
Low-volume areas between POCs indicate prices that were rejected quickly - potential breakout or breakdown levels.
Market Structure
Multiple POCs across price levels show where the market has found acceptance, useful for distinguishing range-bound conditions from trending moves.
+++++
Practical Notes
- Volume Nodes mode with 3-5 POCs works well for identifying distinct S/R clusters
- Higher row counts give more granular analysis on lower timeframes
- Delta Intensity mode quickly shows buyer/seller dominance at each level without the visual noise of split bars
- If POCs are too clustered, increase Min Node Separation; if too spread out, decrease it or set to 0 for auto
- The stats table vs POC comparison is useful for quick directional bias assessment
+++++
Requirements
- Any instrument with volume data
- Works well on futures, forex, and liquid equities
- Pine Script v6
+++++
Version History
v1.1
- Added Volume Nodes mode with peak detection
- Expanded to 8 POC levels
- Added Min Node Separation setting
- Fixed POC label positioning for left placement
- Added black outlines to Up/Down volume bars
v1.0
- Initial release replicating VRVP with multi-POC enhancement
- Delta Intensity mode
- Statistics table
릴리즈 노트
VRVP Clone + Multi-POCOverview
VRVP Clone + Multi-POC replicates TradingView's native Visible Range Volume Profile with several practical enhancements. The indicator displays volume distribution across price levels for the visible chart range, which is useful for identifying high-volume nodes, support/resistance zones, and areas of price acceptance.
The main differentiator from the built-in VRVP is support for multiple Point of Control (POC) lines with an intelligent peak detection algorithm. Instead of just showing the single highest-volume level, you can identify distinct volume clusters across different price zones.
Features
Dynamic Visible Range
- Recalculates automatically on scroll or zoom
- Analyzes only visible bars
- Profile width scales proportionally to view
Multiple POC Detection (1-8 levels)
- Volume Nodes Mode: Peak detection algorithm finds local volume maxima across distinct price clusters
- Highest Rows Mode: Traditional approach - top N rows by raw volume
- Configurable minimum separation between nodes to prevent bunching
- Individual colors for each POC level
Volume Display Modes
- Up/Down: Split bars showing buy vs. sell volume with black outlines for visual separation
- Total: Single bar colored by dominant direction
- Delta: Net volume (buy minus sell)
- Delta Intensity: Gradient coloring indicating buyer/seller dominance strength per row
Volume Distribution Methods
- Uniform: Distributes volume evenly across the bar's price range
- Typical Price Weighted: Weights volume toward (High+Low+Close)/3 - more realistic distribution
- Close Weighted: Weights volume toward the close price
Value Area
- Configurable percentage (default 70%)
- VAH and VAL lines with customizable styles
- Separate colors for volume inside vs. outside the Value Area
Positioning Options
- Left or Right placement
- Adjustable profile width as percentage of visible range
- Row configuration via "Number of Rows" or "Ticks Per Row"
Additional Features
- Statistics table showing bars analyzed, total volume, up/down percentages, price vs POC
- POC price labels on chart
- Line style options (Solid, Dashed, Dotted)
+++++
How It Works
Volume from each bar is distributed across price rows based on the bar's high-low range and the selected distribution method:
- Uniform: Allocation is proportional to overlap - if a bar spans 3 rows with 60% overlap on one row, that row receives 60% of the bar's volume.
- Typical Price Weighted: Uses a triangle distribution centered on the typical price (HLC/3). Rows closer to the typical price receive more volume, which better approximates actual intrabar trading activity.
- Close Weighted: Similar weighting but centered on the close price.
Volume Nodes Mode identifies local peaks in the distribution (rows where volume exceeds both neighbors), then selects the highest peaks while enforcing minimum separation. This surfaces distinct support/resistance clusters rather than stacking all POC lines in a single high-volume area.
The indicator uses a high-resolution internal calculation (400 rows) for accuracy, then aggregates to the user-specified display row count for cleaner visualization.
+++++
Settings
Inputs
Setting - Description
Rows Layout - "Number of Rows", "Ticks Per Row", or "Points Per Row"
Row Size - Number of rows (1-500), ticks per row, or points per row depending on layout
Volume - "Up/Down", "Total", or "Delta"
Value Area % - Percentage of volume for Value Area (default 70%)
Volume Distribution - "Uniform", "Typical Price Weighted", or "Close Weighted"
Enhancements
Setting - Description
- Number of POCs | 1-8 POC lines |
- POC Mode - "Volume Nodes" (peak detection) or "Highest Rows" (traditional)
- Min Node Separation - Minimum rows between nodes (0 = auto-calculate)
- Delta Intensity Mode - Gradient coloring by dominance
- Show Stats Table - Display analysis statistics
Style
Setting - Description
- Up/Down Volume Colors - Buy/sell volume colors
- Value Area Colors - Colors for VA regions
- POC/VAH/VAL Colors - Line colors and styles
- POC 2-8 Colors - Colors for additional POC levels
+++++
Applications
Support/Resistance Identification
High-volume nodes tend to act as price magnets. Multiple POCs reveal layered S/R zones that aren't visible with a single POC.
Fair Value Reference
The Value Area represents where 70% of volume traded. Price tends to revert to this zone.
Volume Gap Analysis
Low-volume areas between POCs indicate prices that were rejected quickly - potential breakout or breakdown levels.
Market Structure
Multiple POCs across price levels show where the market has found acceptance, useful for distinguishing range-bound conditions from trending moves.
+++++
Practical Notes
- Volume Nodes mode with 3-5 POCs works well for identifying distinct S/R clusters
- Higher row counts give more granular analysis on lower timeframes
- Delta Intensity mode quickly shows buyer/seller dominance at each level without the visual noise of split bars
- If POCs are too clustered, increase Min Node Separation; if too spread out, decrease it or set to 0 for auto
- The stats table vs POC comparison is useful for quick directional bias assessment
+++++
Matching TradingView's Native VRVP
To get the closest match to TradingView's built-in VRVP:
- Set Rows Layout to "Points Per Row" (not "Ticks Per Row")
- Set Row Size to match TV's setting (e.g., 50)
- Set Volume Distribution to "Typical Price Weighted"
- Set Volume to "Up/Down"
Note: Minor differences may still exist due to internal calculation methods, but the profile shape, POC location, and value area should closely match.
+++++
Requirements
Any instrument with volume data
Works well on futures, forex, and liquid equities
Pine Script v6
릴리즈 노트
update릴리즈 노트
Update오픈 소스 스크립트
트레이딩뷰의 진정한 정신에 따라, 이 스크립트의 작성자는 이를 오픈소스로 공개하여 트레이더들이 기능을 검토하고 검증할 수 있도록 했습니다. 작성자에게 찬사를 보냅니다! 이 코드는 무료로 사용할 수 있지만, 코드를 재게시하는 경우 하우스 룰이 적용된다는 점을 기억하세요.

면책사항
해당 정보와 게시물은 금융, 투자, 트레이딩 또는 기타 유형의 조언이나 권장 사항으로 간주되지 않으며, 트레이딩뷰에서 제공하거나 보증하는 것이 아닙니다. 자세한 내용은 이용 약관을 참조하세요.
오픈 소스 스크립트
트레이딩뷰의 진정한 정신에 따라, 이 스크립트의 작성자는 이를 오픈소스로 공개하여 트레이더들이 기능을 검토하고 검증할 수 있도록 했습니다. 작성자에게 찬사를 보냅니다! 이 코드는 무료로 사용할 수 있지만, 코드를 재게시하는 경우 하우스 룰이 적용된다는 점을 기억하세요.
면책사항
해당 정보와 게시물은 금융, 투자, 트레이딩 또는 기타 유형의 조언이나 권장 사항으로 간주되지 않으며, 트레이딩뷰에서 제공하거나 보증하는 것이 아닙니다. 자세한 내용은 이용 약관을 참조하세요.