OPEN-SOURCE SCRIPT
업데이트됨 Graveyard Pivots Price Magnet
Graveyard Pivots
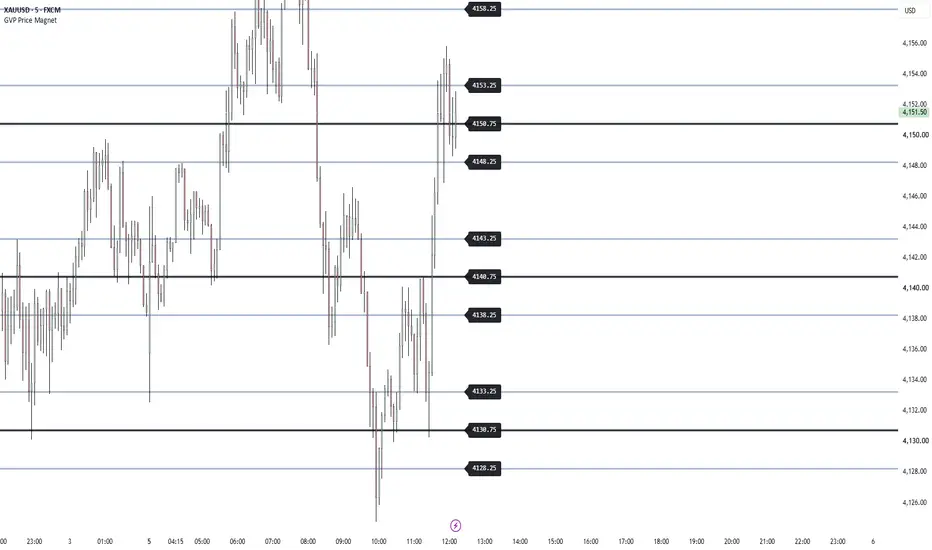
Graveyard Pivots draws a fresh grid of price levels every day, measured from the daily open. It marks the quarter levels (.25, .50 and .75) between each pair of main round-number levels, so you can see where price may stall, react or reverse.
How it works
*Daily anchor. The grid starts from the daily open, so it resets at the start of each new day.
*Automatic step size. The gap between main levels is set from the timeframe and the instrument's tick size and price scale, so it works on forex, stocks, crypto and indices without manual setup.
*Quarter levels. Between each pair of main levels, the script draws a .25 line, a .50 core line and a .75 line.
*Core line. The .50 line is drawn thicker, in black, with a soft glow, so it stands out as the key level.
*Edge lines. The .25 and .75 lines are drawn in light blue.
Settings
*Graves each side of price: how many levels to show above and below price (up to 60 each side).
*Anchor source: Daily Open (default), Prev Day Close, Weekly Open, Monthly Open, Yearly Open, or Zero for a fixed grid that never resets.
*Line widths and colours for the core and edge lines.
*Price tags: optional labels showing each level's price, with an adjustable distance from the last bar.

Graveyard Pivots draws a fresh grid of price levels every day, measured from the daily open. It marks the quarter levels (.25, .50 and .75) between each pair of main round-number levels, so you can see where price may stall, react or reverse.
How it works
*Daily anchor. The grid starts from the daily open, so it resets at the start of each new day.
*Automatic step size. The gap between main levels is set from the timeframe and the instrument's tick size and price scale, so it works on forex, stocks, crypto and indices without manual setup.
*Quarter levels. Between each pair of main levels, the script draws a .25 line, a .50 core line and a .75 line.
*Core line. The .50 line is drawn thicker, in black, with a soft glow, so it stands out as the key level.
*Edge lines. The .25 and .75 lines are drawn in light blue.
Settings
*Graves each side of price: how many levels to show above and below price (up to 60 each side).
*Anchor source: Daily Open (default), Prev Day Close, Weekly Open, Monthly Open, Yearly Open, or Zero for a fixed grid that never resets.
*Line widths and colours for the core and edge lines.
*Price tags: optional labels showing each level's price, with an adjustable distance from the last bar.
릴리즈 노트
Fixes and clarificationsFixed
- Levels now land on clean prices. The anchor (daily open etc.) is rounded to the nearest 25 ticks before the grid is built, so levels read like 4148.25 / 4150.75 / 4153.25 instead of 4148.31 / 4150.81.
- Line and label limits. "Graves Each Side of Price" is now capped at what fits TradingView's limits: 37 per side, or 20 per side with price tags on.
Clarifications
- Only the current grid is drawn, on the latest bar. Past days' grids are not kept on history. The grid re-anchors when a new day starts.
- The main round-number levels (.00) are not drawn. Only the .25, .50 and .75 levels between them are.
- The core line is black by default, so change its colour on dark charts.
- Step = tick size x 1000 (x5 on Daily and 4H+, x10 on Weekly/Monthly) x price scale. Levels = rounded anchor + n x step + 0.25 / 0.50 / 0.75 x step.
No change to colours, line widths, price tags or anchor options.
릴리즈 노트
v1.1.2 - Header restoredRestored: The license and author header (Mozilla Public License 2.0, © ChartTrader-X) was removed by mistake in an earlier update. It is back in this version.
No change to the code, levels, colours or settings.
오픈 소스 스크립트
트레이딩뷰의 진정한 정신에 따라, 이 스크립트의 작성자는 이를 오픈소스로 공개하여 트레이더들이 기능을 검토하고 검증할 수 있도록 했습니다. 작성자에게 찬사를 보냅니다! 이 코드는 무료로 사용할 수 있지만, 코드를 재게시하는 경우 하우스 룰이 적용된다는 점을 기억하세요.

ChartTrader-X
면책사항
해당 정보와 게시물은 금융, 투자, 트레이딩 또는 기타 유형의 조언이나 권장 사항으로 간주되지 않으며, 트레이딩뷰에서 제공하거나 보증하는 것이 아닙니다. 자세한 내용은 이용 약관을 참조하세요.
오픈 소스 스크립트
트레이딩뷰의 진정한 정신에 따라, 이 스크립트의 작성자는 이를 오픈소스로 공개하여 트레이더들이 기능을 검토하고 검증할 수 있도록 했습니다. 작성자에게 찬사를 보냅니다! 이 코드는 무료로 사용할 수 있지만, 코드를 재게시하는 경우 하우스 룰이 적용된다는 점을 기억하세요.
ChartTrader-X
면책사항
해당 정보와 게시물은 금융, 투자, 트레이딩 또는 기타 유형의 조언이나 권장 사항으로 간주되지 않으며, 트레이딩뷰에서 제공하거나 보증하는 것이 아닙니다. 자세한 내용은 이용 약관을 참조하세요.