OPEN-SOURCE SCRIPT
업데이트됨 Magnet Map: AVWAP + HVNs & Delta Concentration

Magnet Map v2 is an upgraded release of my older Magnet Map, utilizing a specialized order-flow suite built on the newly released Pine Script v6 request.footprint() engine. While most traders are looking at lagging indicators, the updated Magnet Map tracks the real-time "tug-of-war" between aggressive buyers and sellers (Delta) to find where price is actually being "trapped" or "absorbed."
This script identifies High-Volume Nodes (HVNs) and the Institutional Point of Control (POC), coloring them dynamically based on market intent. It doesn't just show you where volume is; it shows you who is winning the fight at those levels.
Key Technical Upgrades:
⚡ Institutional POC (Dashed Line): Real-time tracking of the price level with the highest volume and net delta for the current session.
🧲 Delta-Colored HVN Magnets: Historical volume nodes are automatically scanned and colored based on net intent.
Lime: Heavy Aggressive Buying (Support Magnets)
Red: Heavy Aggressive Selling (Resistance Magnets)
🔵 High-Contrast Daily VWAP: A solid blue, 100% opaque VWAP anchor to provide immediate trend context—perfect for black-background charts.
🌑 Dark Mode (Toggleable): Specifically engineered for readability on black screens. Text and lines use high-glow colors that won't get lost in the dark.
🔔 Intelligent Alert System: Built-in logic for "Any alert() function" calls, providing specific notifications for POC crosses, Magnet touches, and Hidden Absorption (Divergence between price and delta).
Optimization & Asset Guide:
To ensure the "Magnets" are accurate, use these recommended settings:
Indices (SPY/QQQ): Ticks Per Row: 5 to 10 | Delta Threshold: 1000+ | Bin Count: 50
---NOTE for 0DTE Option Traders (especially on SPY/QQQ)!!! The Institutional POC is the "Line in the Sand." If price is above the POC and the POC Delta is Lime, the trend is likely to continue. If price crosses the POC with a Red Delta, the "Magnet" has flipped, and it's time to look at the downside HVNs.
High-Beta Tech (TSLA/NVDA): Ticks Per Row: 2-5 | Delta Threshold: 300-500
Small Caps: Ticks Per Row: 1 | Delta Threshold: 50-150
How to Trade the Map:
The Vacuum Effect: Price is statistically drawn to HVNs. Use these levels as high-probability Take Profit targets.
The POC Wall: Treat the Institutional POC as the "Line in the Sand." Trading above it with a Lime Delta is a strong bullish signal.
Requirements: TradingView Premium or Ultimate (to access Footprint data).
Best Uses:
Timeframes: 1m, 5m, 15m (Best for Tick Data).
Interpretation:
🟢 Positive Delta Zones (Bullish Magnets)
A Positive Delta zone (marked Lime in your script) is a price level where Aggressive Buyers were in control.
The Logic: At this price, traders weren't waiting for a limit order to get filled; they were market-buying with size, indicating high conviction that the price was headed higher.
The "Magnet" Effect: These zones often act as Support. If the price returns to a Positive Delta HVN, those same aggressive buyers often "defend" their position, or the lack of selling pressure at that level causes a bounce.
🔴 Negative Delta Zones (Bearish Magnets)
A Negative Delta zone (marked Red in your script) is a price level where Aggressive Sellers dominated the auction.
The Logic: This shows "Heavy Handed" selling. Large participants were slamming the "Bid" to get out of positions or enter shorts immediately.
The "Magnet" Effect: These zones typically act as Resistance. When the price drifts back up to a Red HVN, it's hitting a wall of supply where aggressive sellers previously overwhelmed the market.
⚖️ Why the "Delta Flip" Matters
The most powerful signal occurs when the Delta flips against the price movement.
Bullish Absorption: If price is falling into a Red (Negative) HVN but the POC Delta suddenly turns Lime (Positive), it means aggressive sellers are hitting a "Brick Wall" of passive buy orders. The sellers are exhausted, and a reversal is likely.
Bearish Absorption: If price is rising into a Lime (Positive) HVN but the POC Delta turns Red (Negative), the aggressive buyers are being "fed" by a massive hidden seller.
Script by TylerisTrading
릴리즈 노트
Magnet Map v2 is an upgraded release of my older Magnet Map, utilizing a specialized order-flow suite built on the newly released Pine Script v6 request.footprint() engine. While most traders are looking at lagging indicators, the updated Magnet Map tracks the real-time "tug-of-war" between aggressive buyers and sellers (Delta) to find where price is actually being "trapped" or "absorbed."This script identifies High-Volume Nodes (HVNs) and the Institutional Point of Control (POC), coloring them dynamically based on market intent. It doesn't just show you where volume is; it shows you who is winning the fight at those levels.
Key Technical Upgrades:
⚡ Institutional POC (Dashed Line): Real-time tracking of the price level with the highest volume and net delta for the current session.
🧲 Delta-Colored HVN Magnets: Historical volume nodes are automatically scanned and colored based on net intent.
Lime: Heavy Aggressive Buying (Support Magnets)
Red: Heavy Aggressive Selling (Resistance Magnets)
🔵 High-Contrast Daily VWAP: A solid blue, 100% opaque VWAP anchor to provide immediate trend context—perfect for black-background charts.
🌑 Dark Mode (Toggleable): Specifically engineered for readability on black screens. Text and lines use high-glow colors that won't get lost in the dark.
🔔 Intelligent Alert System: Built-in logic for "Any alert() function" calls, providing specific notifications for POC crosses, Magnet touches, and Hidden Absorption (Divergence between price and delta).
Optimization & Asset Guide:
To ensure the "Magnets" are accurate, use these recommended settings:
Indices (SPY/QQQ): Due to their volume, I previously had a set of inputs listed as suggested inputs to make it more accurate. To prevent having to manually alter the inputs for index charts, I've created an updated script which can be found directly below to use specifically for indices:
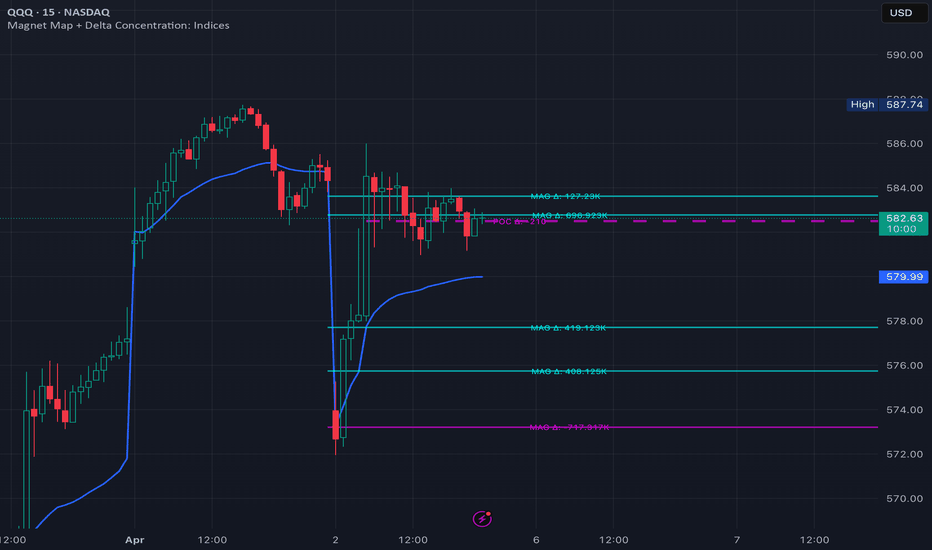
High-Beta Tech (TSLA/NVDA): Ticks Per Row: 2-5 | Delta Threshold: 300-500
Small Caps: Ticks Per Row: 1 | Delta Threshold: 50-150
How to Trade the Map:
The Vacuum Effect: Price is statistically drawn to HVNs. Use these levels as high-probability Take Profit targets.
The POC Wall: Treat the Institutional POC as the "Line in the Sand." Trading above it with a Lime Delta is a strong bullish signal.
Requirements: TradingView Premium or Ultimate (to access Footprint data).
Best Uses:
Timeframes: 1m, 5m, 15m (Best for Tick Data).
Interpretation:
🟢 Positive Delta Zones (Bullish Magnets)
A Positive Delta zone (marked Lime in your script) is a price level where Aggressive Buyers were in control.
The Logic: At this price, traders weren't waiting for a limit order to get filled; they were market-buying with size, indicating high conviction that the price was headed higher.
The "Magnet" Effect: These zones often act as Support. If the price returns to a Positive Delta HVN, those same aggressive buyers often "defend" their position, or the lack of selling pressure at that level causes a bounce.
🔴 Negative Delta Zones (Bearish Magnets)
A Negative Delta zone (marked Red in your script) is a price level where Aggressive Sellers dominated the auction.
The Logic: This shows "Heavy Handed" selling. Large participants were slamming the "Bid" to get out of positions or enter shorts immediately.
The "Magnet" Effect: These zones typically act as Resistance. When the price drifts back up to a Red HVN, it's hitting a wall of supply where aggressive sellers previously overwhelmed the market.
⚖️ Why the "Delta Flip" Matters
The most powerful signal occurs when the Delta flips against the price movement.
Bullish Absorption: If price is falling into a Red (Negative) HVN but the POC Delta suddenly turns Lime (Positive), it means aggressive sellers are hitting a "Brick Wall" of passive buy orders. The sellers are exhausted, and a reversal is likely.
Bearish Absorption: If price is rising into a Lime (Positive) HVN but the POC Delta turns Red (Negative), the aggressive buyers are being "fed" by a massive hidden seller.
---Note: Given the dynamic focus of this indicator, I have also created a backtracking Magnet Map that plots levels of significant buying/selling pressure that have been untouched. It can be found directly below:
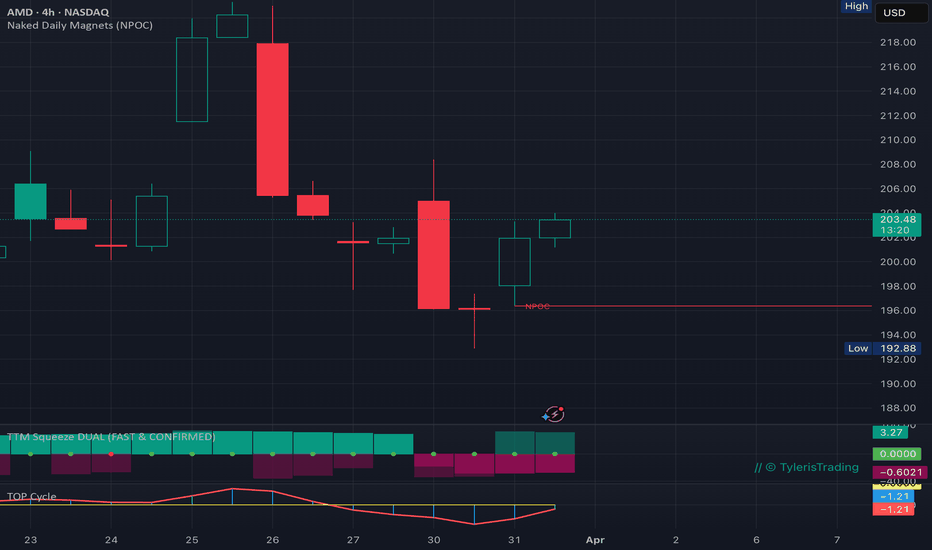
Script by TylerisTrading
오픈 소스 스크립트
트레이딩뷰의 진정한 정신에 따라, 이 스크립트의 작성자는 이를 오픈소스로 공개하여 트레이더들이 기능을 검토하고 검증할 수 있도록 했습니다. 작성자에게 찬사를 보냅니다! 이 코드는 무료로 사용할 수 있지만, 코드를 재게시하는 경우 하우스 룰이 적용된다는 점을 기억하세요.

// © TylerisTrading
면책사항
해당 정보와 게시물은 금융, 투자, 트레이딩 또는 기타 유형의 조언이나 권장 사항으로 간주되지 않으며, 트레이딩뷰에서 제공하거나 보증하는 것이 아닙니다. 자세한 내용은 이용 약관을 참조하세요.
오픈 소스 스크립트
트레이딩뷰의 진정한 정신에 따라, 이 스크립트의 작성자는 이를 오픈소스로 공개하여 트레이더들이 기능을 검토하고 검증할 수 있도록 했습니다. 작성자에게 찬사를 보냅니다! 이 코드는 무료로 사용할 수 있지만, 코드를 재게시하는 경우 하우스 룰이 적용된다는 점을 기억하세요.
// © TylerisTrading
면책사항
해당 정보와 게시물은 금융, 투자, 트레이딩 또는 기타 유형의 조언이나 권장 사항으로 간주되지 않으며, 트레이딩뷰에서 제공하거나 보증하는 것이 아닙니다. 자세한 내용은 이용 약관을 참조하세요.